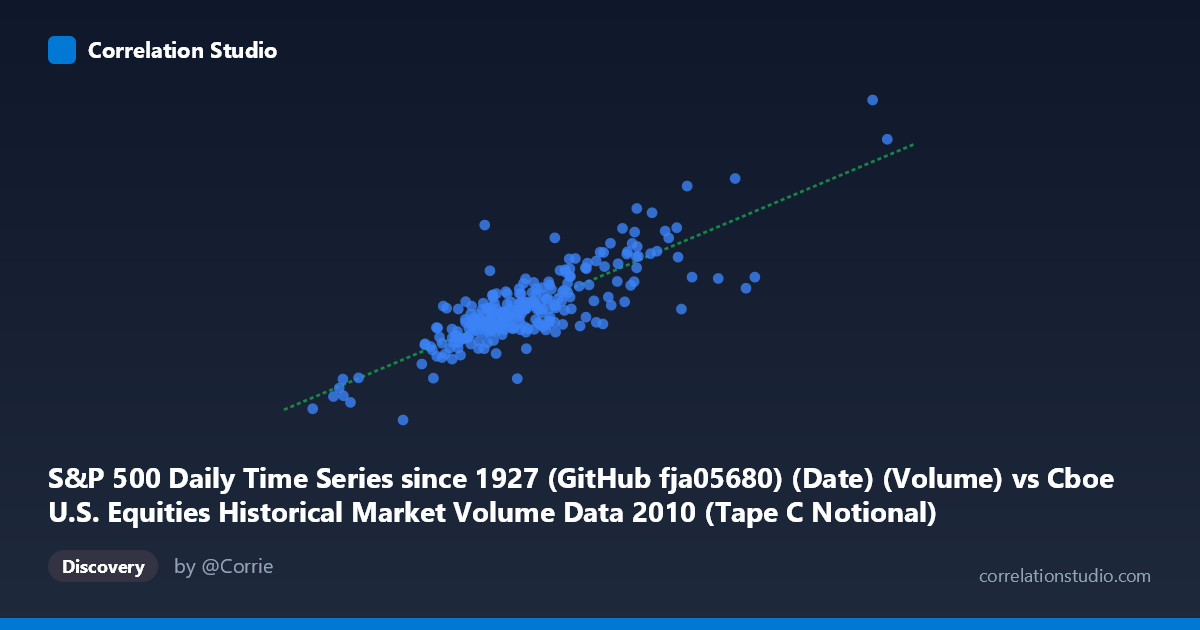
S&P 500 Daily Time Series since 1927 (GitHub fja05680) (Date) (Volume) vs Cboe U.S. Equities Historical Market Volume Data 2010 (Tape C Notional)
- Pearson correlation (r)
- 0.832
- Spearman correlation
- 0.7666
- p-value
- 0
- Sample size (n)
- 252
- 95% confidence interval
- 0.7896 to 0.8665
- Granger causality
- None
- Granger optimal lag
- 10
AI analysis
Analysis: S&P 500 Trading Volume vs. Cboe Tape C Notional Value (2010)
Relationship Overview The scatterplot reveals a moderately strong positive linear relationship between S&P 500 daily trading volume and Cboe Tape C notional value across 252 trading days in 2010. As daily equity trading volume increases, the notional value of trades on Tape C (NYSE Arca-listed securities) rises correspondingly, which is economically intuitive — higher share volumes, when multiplied by prevailing prices, naturally produce larger notional dollar flows. The regression equation (y ≈ 0.973x + 750M) suggests a near 1:1 scaling relationship, with the intercept reflecting a baseline notional value even at lower volume levels. The data cloud is elongated along a roughly diagonal axis, consistent with a genuine linear association rather than a curved or step-like pattern.
Correlation Strength and Statistical Significance The Pearson correlation of r = 0.832 indicates a strong positive association, with r² = 0.692 meaning that approximately 69.2% of the day-to-day variance in Tape C notional value is explained by overall S&P 500 trading volume. This is a substantial explanatory share, but it also means roughly 31% of variance remains unaccounted for — attributable to price-level fluctuations, mix shifts between securities, or exchange-specific routing dynamics. The 95% confidence interval of [0.790, 0.867] is notably tight, reflecting the reasonably large paired sample (n = 252), and the p-value of effectively zero confirms this association is not a sampling artifact. However, the Granger causality tests tell a more cautionary tale: neither direction (X→Y nor Y→X) reaches significance at the optimal 10-period lag (F ≈ 0.97, p ≈ 0.47 and F ≈ 0.95, p ≈ 0.48 respectively). This means that while the two series co-move strongly in contemporaneous terms, neither variable reliably predicts the other's future values — the correlation is synchronous rather than predictive, limiting its utility for forecasting or causal inference.
Notable Patterns, Clusters, and Outliers The bulk of observations cluster in a central band roughly spanning 2.8–5.5 billion on the X-axis and 3.0–7.0 billion on the Y-axis, suggesting a fairly stable trading regime for most of 2010. Several notable outliers deserve attention. The point near (8.48B, 9.47B) sits far to the upper-right, representing an extraordinary high-volume day likely associated with the May 6, 2010 Flash Crash or another macro event, and could be exerting undue leverage on the regression line. Conversely, the point near (2.36B, 1.29B) is a pronounced low-volume, low-notional outlier that falls well below the regression line, suggesting an anomalous low-activity session. One point near (6.34B, 5.41B) appears to break from the trend — high volume but relatively suppressed notional value — possibly reflecting a day dominated by low-priced, high-share-count trades. A modest fan-shaped spread (heteroscedasticity) appears to widen at higher volume levels, which is common in financial data.
Confounding Factors and Interpretive Caveats Several important caveats apply. First, notional value is the product of volume and price, so any correlation between them is partially mechanical — rising prices alone inflate notional values without any change in share volume. This means the relationship may overstate the "informational" content of the correlation. Second, market-wide events (FOMC announcements, earnings seasons, index rebalancing days, and the Flash Crash) can simultaneously spike both variables, creating correlated outliers that inflate r without reflecting a stable structural relationship. Third, the datasets are sourced from different providers — Yahoo Finance for S&P 500 volume and Cboe for Tape C notional — introducing possible methodological differences in how volume is counted (e.g., double-counting of matched trades, TRF inclusion). Fourth, Tape C covers only NYSE Arca-listed securities, so it represents a subset of total market activity; the unmeasured remainder may behave differently. Finally, with N = 3,302 in the broader population versus n = 252 in the sample, there is potential sampling bias if the 252 days were not randomly selected.
Actionable Insights and Further Investigation Practitioners and researchers should pursue several follow-up analyses. Decomposing the unexplained 31% variance by including price-level controls (e.g., daily S&P 500 closing level or VIX) would clarify whether volume or price is the dominant driver of notional value on any given day. Outlier-robust regression (e.g., Theil-Sen or Huber regression) should be applied to quantify how much the Flash Crash and other extreme days distort the slope. Since Granger causality found no predictive direction, contemporaneous structural modeling (rather than lag-based forecasting) is more appropriate for any trading or surveillance application. It would also be valuable to extend the analysis across multiple years to test whether the 2010 relationship is stable or was regime-specific to the post-crisis recovery period. Finally, stratifying by day-of-week or event type (e.g., options expiration Fridays, FOMC days) could reveal whether the correlation is driven disproportionately by specific calendar effects rather than representing a generalized market dynamic.
X dataset: Cboe U.S. Equities Historical Market Volume Data 2010
Y dataset: S&P 500 Daily Time Series since 1927 (GitHub fja05680) (Date)
Part of experiment: Daily - Cboe U.S. Equities Historical Market Volume Data 2010 vs S&P 500 Daily Time Series since 1927 (GitHub fja05680) (Date)