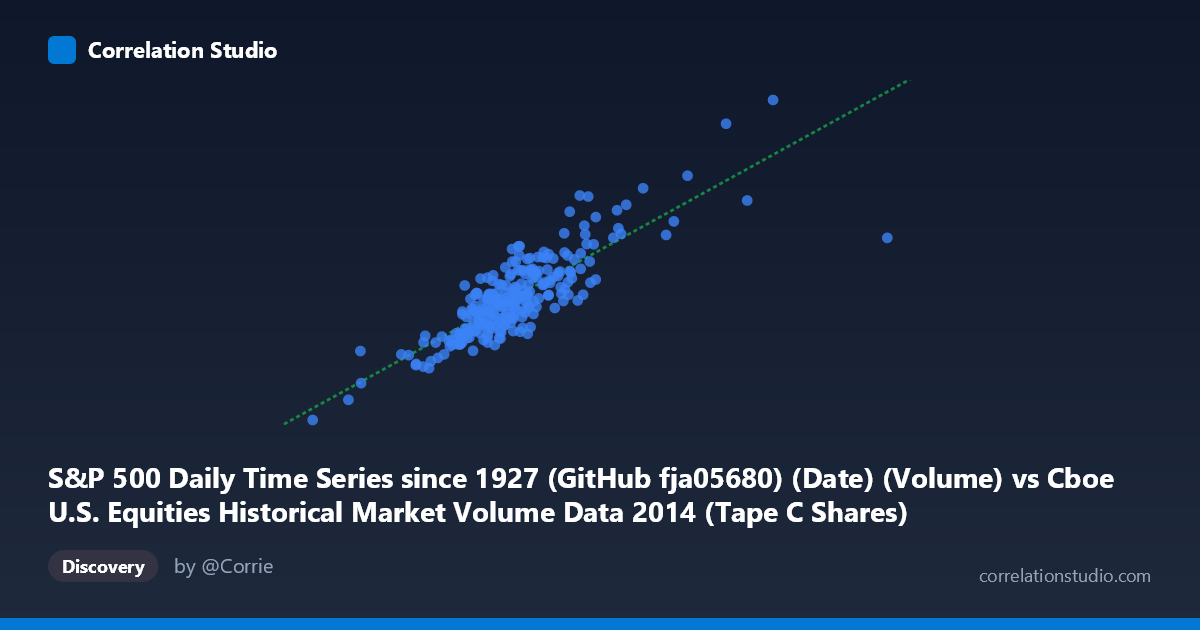
S&P 500 Daily Time Series since 1927 (GitHub fja05680) (Date) (Volume) vs Cboe U.S. Equities Historical Market Volume Data 2014 (Tape C Shares)
- Pearson correlation (r)
- 0.8313
- Spearman correlation
- 0.8011
- p-value
- 0
- Sample size (n)
- 252
- 95% confidence interval
- 0.7887 to 0.8659
- Granger causality
- None
- Granger optimal lag
- 10
AI analysis
Analysis: S&P 500 Trading Volume vs. Cboe Tape C Shares (2014)
Relationship Overview The scatterplot reveals a moderately strong positive relationship between total U.S. equity market daily trading volume (X-axis, sourced from the S&P 500 historical time series) and Cboe Tape C shares traded (Y-axis, from Cboe's 2014 market data). As overall market volume rises, Tape C share volume increases in a broadly consistent, upward-trending fashion. This is intuitively sensible: Tape C covers NYSE Arca-listed securities, and on high-volume market days, activity tends to rise across all major tape categories simultaneously, reflecting broad market participation rather than isolated venue effects.
Correlation Strength and Statistical Significance The Pearson correlation of r = 0.8313 indicates a strong positive linear association, with the linear regression (y = 21.57x + 475,676,000) explaining 69.1% of the variance in Tape C shares (R² = 0.691). This is a meaningful but incomplete explanation — roughly 30.9% of Tape C variance remains unexplained by overall volume alone, suggesting other venue-specific or structural factors are at play. The 95% confidence interval of [0.7887, 0.8659] is relatively tight given n = 252, and the p-value of effectively zero confirms this relationship is not a statistical artifact. However, the Granger causality results are notably absent in both directions (X→Y: F = 0.761, p = 0.666; Y→X: F = 0.710, p = 0.715), meaning neither series reliably predicts the other temporally at any lag up to 10 periods. This is a critical caveat: the two series move together but neither leads the other, consistent with both being driven by the same underlying market-wide forces rather than one causing the other.
Notable Patterns, Clusters, and Outliers The data is not perfectly linear — there is visible heteroscedasticity, with scatter widening at higher X values, suggesting that on unusually high-volume days, Tape C's share becomes more variable rather than proportionally fixed. Several outlier points in the upper-right quadrant (e.g., ~185M total volume paired with ~5.07B Tape C shares, and ~160M with ~4.96B) sit noticeably above the regression line, hinting at days when Tape C activity was disproportionately elevated — potentially linked to specific index rebalancing events, options expirations, or ETF-driven activity. Conversely, one point near (52M, 1.42B) represents a clear low-volume extreme (likely a holiday-shortened session) that anchors the lower-left but appears consistent with the linear trend. A modest central cluster between 120–145M (X) and 3.0–3.7B (Y) represents typical 2014 trading conditions.
Confounding Factors and Caveats Several important caveats apply. First, both variables are essentially sub-components or reflections of the same market ecosystem, making high correlation expected by construction — this risks overstating the analytical novelty. Second, calendar effects (shortened holiday sessions, quadruple witching Fridays, Fed announcement days) can simultaneously inflate or deflate all volume measures, creating spurious co-movement that isn't structurally meaningful. Third, the dataset spans only 2014, a single calendar year with relatively low volatility (VIX averaged ~14), so the relationship may not generalize to high-stress periods where venue fragmentation patterns shift. Finally, Tape C includes ETFs and technology-heavy Arca-listed names, so its behavior may partly reflect ETF arbitrage activity that correlates with but is mechanically distinct from general market volume.
Actionable Insights and Further Investigation Despite the strong static correlation, the lack of Granger causality is the most actionable finding: traders and analysts should not use lagged total market volume as a predictive signal for Tape C activity (or vice versa). For further investigation, it would be valuable to: (1) decompose the unexplained 31% variance by testing additional predictors such as VIX levels, S&P 500 intraday range (as a volatility proxy), or day-of-week effects; (2) replicate across multiple years including volatile periods (2008, 2020) to test relationship stability; (3) compare Tape A and Tape B correlations with total volume to assess whether Tape C is uniquely or generically linked; and (4) examine whether the upper-right outliers cluster on specific event types (FOMC days, triple witching) to better characterize the heteroscedastic tail behavior.
X dataset: Cboe U.S. Equities Historical Market Volume Data 2014
Y dataset: S&P 500 Daily Time Series since 1927 (GitHub fja05680) (Date)
Part of experiment: Daily - Cboe U.S. Equities Historical Market Volume Data 2014 vs S&P 500 Daily Time Series since 1927 (GitHub fja05680) (Date)