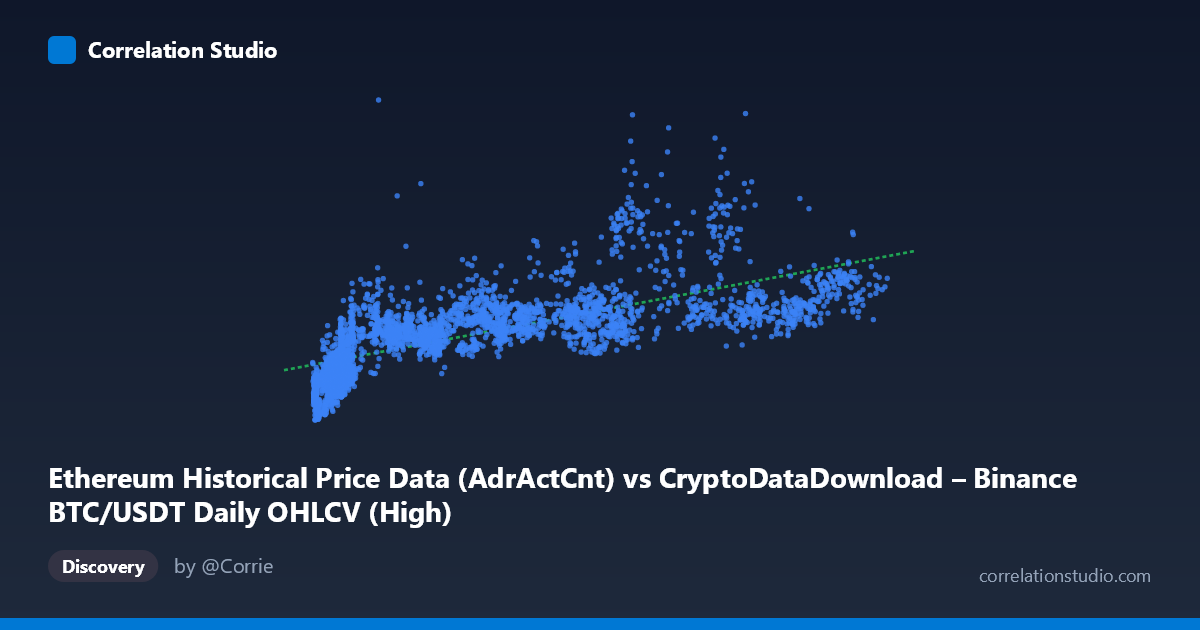
Ethereum Historical Price Data (AdrActCnt) vs CryptoDataDownload – Binance BTC/USDT Daily OHLCV (High)
- Pearson correlation (r)
- 0.6972
- Spearman correlation
- 0.8297
- p-value
- 0
- Sample size (n)
- 3191
- 95% confidence interval
- 0.6789 to 0.7146
- Granger causality
- None
- Granger optimal lag
- 10
AI analysis
Analysis: Ethereum Active Addresses vs. BTC/USDT Price
1. Relationship Overview
The scatterplot reveals a moderate-to-strong positive relationship between the X variable (labeled here as Ethereum Active Address Count, though the surrounding metadata suggests possible column mislabeling with BTC OHLCV data) and Y (BTC/USDT High price). As X increases from its minimum (~3,277) toward higher values, Y generally trends upward, but with substantial scatter rather than a tight linear band. The relationship appears to flatten or saturate at higher X values — several points with X 80,000 cluster in the 520,000–640,000 range for Y, while a few high-X points (e.g., X≈68,000–90,000) spike to 860,000–999,000, suggesting the relationship is not uniformly linear across the full range.
2. Strength, Direction, and Statistical Confidence
The Pearson correlation (r = 0.697) indicates a moderately strong positive association, with r² = 0.486 meaning only about 49% of the variance in Y is explained by X — leaving over half of Y's variability attributable to other factors or noise. The 95% CI [0.679, 0.715] is tight given the large sample (n=3,191), and the p-value of ~0 confirms the correlation is highly statistically significant and not due to chance. However, statistical significance here reflects sample size more than practical predictive strength — r² below 0.5 means this is a useful but incomplete predictor.
Critically, the Granger causality tests show no significant temporal predictive direction in either direction (X→Y: p=0.74; Y→X: p=0.67). This is an important caveat: despite the contemporaneous correlation, neither variable reliably forecasts the other over time. This suggests the correlation may arise from both series responding to a common external driver (e.g., overall crypto market sentiment, macro liquidity cycles) rather than one causing the other.
3. Notable Patterns and Non-linearity
Several features stand out: - Low-X cluster (X < 15,000): Y values are also lower (150,000–620,000) but show wide dispersion, including notable outliers like (4,380, 150,248) and (14,339, 614,264) — very different Y for similar X. - Mid-range plateau: Between X=40,000–85,000, Y often sits in a stable 500,000–650,000 band, suggesting diminishing marginal effect of X on Y. - High-Y outliers: Points like (82,850, 936,565), (68,653, 999,185), and (67,684, 976,428) break from the general trend, indicating episodic spikes not explained by X alone — possibly market shocks or bull-run events. - The note that Spearman ρ exceeds Pearson r strongly supports a non-linear (likely logarithmic or power-law) relationship, common in crypto price/activity data, where diminishing returns occur at scale.
4. Confounding Factors and Caveats
Several caveats limit causal interpretation: - Metadata inconsistency: The X-axis is labeled "AdrActCnt" but described as BTC OHLCV data — this labeling conflict should be resolved before drawing domain conclusions. - Shared market regime: BTC and ETH prices/activity are both driven by common macro factors (crypto market cycles, regulatory news, liquidity, Bitcoin dominance effects), which can inflate correlation without direct causal linkage. - Non-stationarity: Both price and network activity series likely trend over time (2017–2026 span covers multiple bull/bear cycles), which can produce spurious correlation in non-detrended time series. - Lack of Granger causality reinforces that this is likely a spurious or confounded correlation rather than a predictive relationship.
5. Recommendations for Further Investigation
- Clarify data labeling to confirm what X and Y actually represent before further modeling. - Fit non-linear models (log-log or polynomial regression) given the Spearman/Pearson divergence — this could meaningfully improve explained variance. - De-trend or use returns/differences instead of raw levels to test for genuine short-term co-movement, removing long-term trend confounding. - Test lagged cross-correlations at finer granularity (e.g., 1–5 day lags) since Granger tests at lag=10 may miss shorter-term dynamics. - Include a third variable (e.g., overall market cap, BTC dominance, or macro liquidity index) to test whether the X-Y correlation is mediated by a common factor.
X dataset: CryptoDataDownload – Binance BTC/USDT Daily OHLCV
Y dataset: Ethereum Historical Price Data
Part of experiment: Bitcoin - CryptoDataDownload – Binance BTC/USDT Daily OHLCV vs Ethereum Historical Price Data