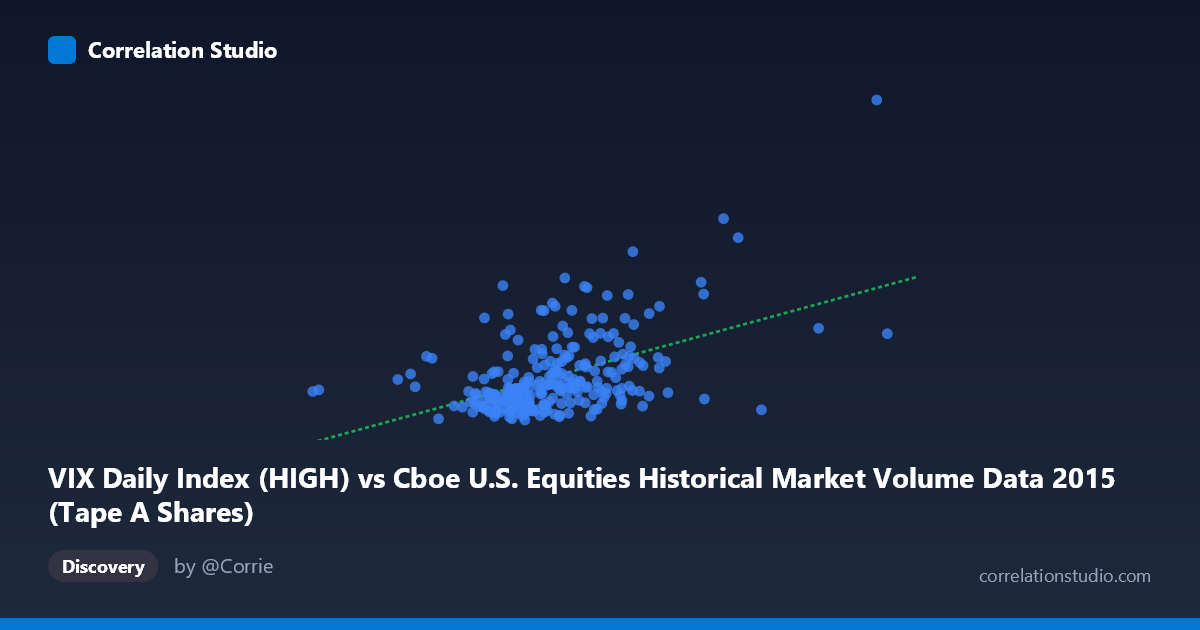
VIX Daily Index (HIGH) vs Cboe U.S. Equities Historical Market Volume Data 2015 (Tape A Shares)
- Pearson correlation (r)
- 0.4914
- Spearman correlation
- 0.4391
- p-value
- 0
- Sample size (n)
- 252
- 95% confidence interval
- 0.3916 to 0.5798
- Granger causality
- None
- Granger optimal lag
- 1
AI analysis
Scatterplot Analysis: VIX Daily Index (HIGH) vs. Tape A Shares Volume
Overall Relationship and Visual Pattern
The scatterplot reveals a moderate positive relationship between the VIX Daily Index High values and Tape A Shares trading volume across 2015 U.S. equity markets. As VIX High readings increase, Tape A share volume tends to rise as well, consistent with the well-established market intuition that elevated volatility coincides with heightened trading activity. The linear regression equation (y = 4.932×10⁻⁸x + 3.9914) captures this upward trend, though the scatter around the regression line is considerable, indicating that the relationship is real but far from deterministic. The bulk of observations cluster in the lower-left portion of the plot — low-to-moderate VIX values paired with relatively modest share volumes — with a visible upward dispersion as VIX readings climb.
Correlation Strength, Direction, and Statistical Significance
The Pearson correlation of r = 0.4914 indicates a moderate positive association. However, the more practically informative metric is r² = 0.2415, meaning that VIX High values explain only about 24.1% of the variance in Tape A share volume. Put differently, roughly three-quarters of the variability in trading volume is attributable to factors other than VIX levels. The 95% confidence interval for r [0.3916, 0.5798] is meaningfully above zero and does not include it, and the p-value is effectively zero against a population of N = 3,302, confirming that this is a statistically robust, non-spurious association. That said, statistical significance at this sample size should not be conflated with practical magnitude — the effect, while real, is modest. Critically, the Granger causality tests return no significant directional relationship in either direction (X→Y: F = 0.0036, p = 0.952; Y→X: F = 0.511, p = 0.476), meaning that past VIX High values do not reliably predict future Tape A volume, nor does past volume predict future VIX. The correlation is contemporaneous and associative, not temporally predictive.
Notable Patterns, Clusters, and Outliers
The sample points highlight several structural features worth noting. The data exhibits a dense core cluster roughly between VIX values of 230M–300M and Tape A shares of 12–20, suggesting that the majority of 2015 trading days were characterized by moderate volatility and normal volume regimes. However, there are clear high-leverage outliers in the upper-right quadrant — notably observations near (401M, 38.06) and (387M, 28.38) — that likely correspond to specific volatility episodes in 2015, most plausibly the August 2015 China-driven market selloff, which produced brief but extreme VIX spikes and volume surges. One observation at the far-left extreme (108M, 15.88) also stands out as an unusually low VIX reading, possibly representing a holiday-shortened session or an anomalous low-activity day. The relationship also hints at non-linearity: volume appears to accelerate disproportionately at higher VIX levels rather than increasing linearly, suggesting a threshold or regime-change dynamic that a simple linear fit may understate.
Confounding Factors and Interpretive Caveats
Several important caveats apply. First, market structure changes and calendar effects within 2015 (e.g., quarter-end rebalancing, options expiration dates, FOMC meeting days) can independently drive both VIX and volume, creating spurious co-movement that inflates the apparent correlation. Second, the directionality of the axes deserves scrutiny: the metadata suggests that what is labeled as the X-axis (VIX HIGH) comes from the volume dataset, and the Y-axis (Tape A Shares) comes from the VIX dataset — this labeling inversion should be verified before drawing firm conclusions about which variable is being treated as the predictor. Third, Tape A shares represent only NYSE-listed securities, so the relationship may differ for Tape B (NASDAQ) or Tape C instruments. Fourth, the VIX itself is a forward-looking implied volatility measure rather than realized volatility, meaning its relationship to same-day volume reflects expectations and sentiment rather than observed price moves. Finally, the 24.1% explained variance confirms that omitted variables — such as macroeconomic news releases, Federal Reserve communications, and algorithmic trading patterns — play a dominant role.
Actionable Insights and Further Investigation
Practitioners and researchers should consider several follow-up analyses. First, regime segmentation — splitting the data into normal (VIX < 20) and elevated (VIX ≥ 20) volatility periods — would likely reveal meaningfully different correlation structures and could improve predictive models. Second, given the absence of Granger causality, same-day or intraday analysis may be more fruitful than lagged models for capturing the volume-volatility nexus. Third, incorporating additional volume metrics (e.g., notional value, trade counts) alongside Tape A shares could help disentangle whether the VIX-volume relationship is driven by trade frequency, trade size, or both. Fourth, extending the analysis to multiple years would test whether the 2015 relationship — heavily influenced by the August volatility spike — is structurally stable or episodic. Finally, applying a log transformation to share volume (which is likely right-skewed) or fitting a non-linear model could meaningfully improve explanatory power beyond the current 24.1% baseline.
X dataset: Cboe U.S. Equities Historical Market Volume Data 2015
Y dataset: VIX Daily Index
Part of experiment: Daily - Cboe U.S. Equities Historical Market Volume Data 2015 vs VIX Daily Index