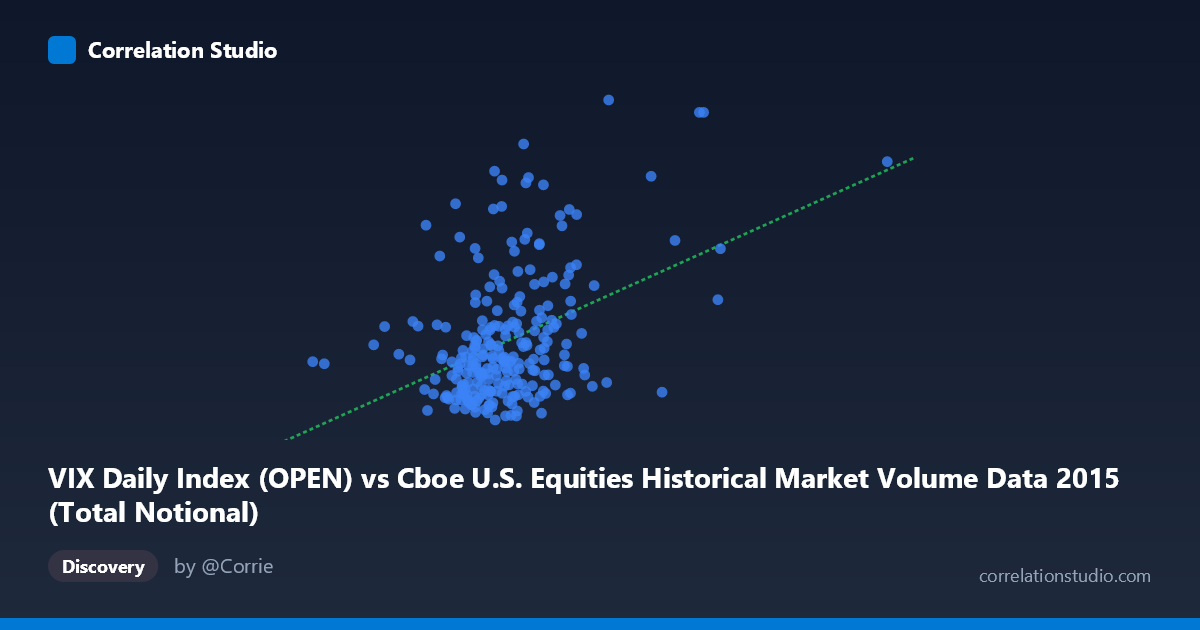
VIX Daily Index (OPEN) vs Cboe U.S. Equities Historical Market Volume Data 2015 (Total Notional)
- Pearson correlation (r)
- 0.4158
- Spearman correlation
- 0.3245
- p-value
- 0
- Sample size (n)
- 252
- 95% confidence interval
- 0.3081 to 0.513
- Granger causality
- None
- Granger optimal lag
- 1
AI analysis
Scatterplot Analysis: VIX Daily Index (OPEN) vs. Total Notional Market Volume (2015)
Overall Relationship The scatterplot reveals a modest positive relationship between the Cboe VIX Daily Index opening values and total notional market volume for U.S. equities in 2015. As market volume (X-axis, ranging from ~$7.2B to ~$48.9B) increases, VIX levels (Y-axis, ranging from ~11.77 to ~31.91) tend to rise, consistent with the intuitive notion that elevated trading activity often accompanies periods of heightened market uncertainty or fear. However, the scatter is considerable, meaning many data points deviate substantially from the regression line (y = 3.90E-10x + 8.42), signaling that this relationship is far from deterministic.
Correlation Strength and Statistical Significance With r = 0.4158, the correlation is statistically positive but only moderate in practical terms. More tellingly, r² = 0.1729, meaning total notional volume explains just 17.3% of the variance in VIX levels — leaving roughly 83% attributable to other factors. The 95% confidence interval [0.3081, 0.5130] is reasonably narrow given N = 3,302, confirming the correlation is reliably non-zero, and the p-value of 5.9E-12 makes it highly statistically significant. However, statistical significance here is partly a product of the large population size and should not be conflated with practical or predictive strength. Critically, Granger causality tests find no significant temporal predictive direction in either direction (X→Y: F = 0.27, p = 0.60; Y→X: F = 0.14, p = 0.71), meaning that knowing yesterday's volume does not meaningfully help predict today's VIX, and vice versa. The relationship is contemporaneous at best — correlated, but neither variable reliably leads the other.
Notable Patterns, Clusters, and Outliers The bulk of observations cluster in the $15B–$25B notional volume range paired with VIX values between 12 and 20, reflecting the relatively calm market conditions that dominated much of early-to-mid 2015. However, several high-leverage outliers are clearly visible in the upper-right quadrant — notably points near ($35.6B, 31.13) and ($36.8B, 22.55), likely corresponding to the August 2015 volatility spike driven by China's currency devaluation and global growth fears. There is also a notable low-volume, low-VIX cluster and at least one anomalous point at the extreme left (~$7.2B, 15.44) that may reflect a holiday-shortened or otherwise atypical trading session. The distribution appears somewhat heteroscedastic — variance in VIX widens noticeably at higher volume levels — suggesting the linear model may underfit the tail behavior.
Confounding Factors and Interpretive Caveats Several important caveats apply. First, reverse causality and simultaneity are plausible: both VIX and market volume likely respond to the same underlying macroeconomic shocks (e.g., Fed rate decisions, geopolitical events) rather than one causing the other. Second, the axes appear swapped from convention — the dataset metadata indicates the Y-axis column belongs to the VIX dataset while being labeled "Total Notional," suggesting a possible dataset/column label mismatch worth verifying before drawing conclusions. Third, seasonal patterns within 2015 (e.g., low-volatility spring, turbulent August-September) could be driving the apparent correlation as a spurious byproduct of time clustering rather than a structural relationship. Finally, the linear regression's assumption of homoscedasticity appears violated given the fan-shaped spread at higher volumes.
Actionable Insights and Further Investigation Despite its limitations, this analysis offers several actionable directions. Risk managers and trading desks could explore whether extreme volume days ($30B notional) warrant elevated VIX hedging, given their observed tendency to coincide with volatility spikes. Further investigation should include: (1) lagged cross-correlation analysis across multiple lag periods beyond the single-period Granger test to capture slower-moving relationships; (2) segmenting the data by market regime (calm vs. stressed periods) to test whether the correlation strengthens during crisis windows like August 2015; (3) introducing control variables such as S&P 500 returns, bid-ask spreads, or options open interest to disentangle confounders; and (4) verifying the column-to-dataset attribution to ensure the axes represent what they are labeled. A non-linear model (e.g., quantile regression or piecewise linear) may also better capture the apparent threshold effect at high volume levels.
X dataset: Cboe U.S. Equities Historical Market Volume Data 2015
Y dataset: VIX Daily Index
Part of experiment: Daily - Cboe U.S. Equities Historical Market Volume Data 2015 vs VIX Daily Index