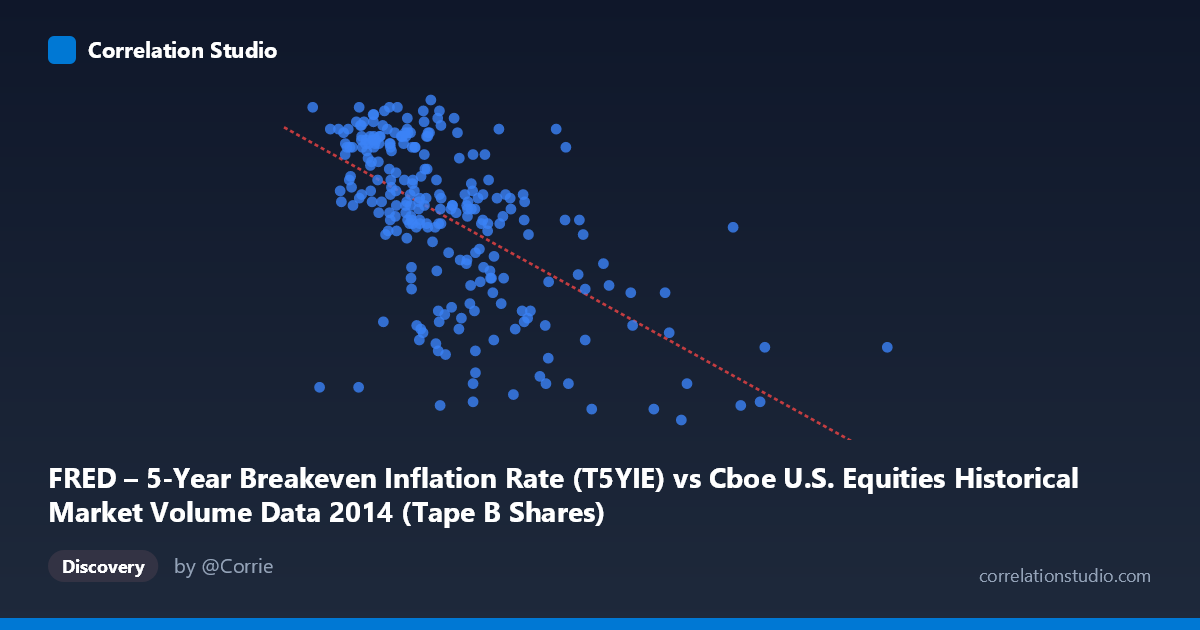
FRED – 5-Year Breakeven Inflation Rate (T5YIE) vs Cboe U.S. Equities Historical Market Volume Data 2014 (Tape B Shares)
- Pearson correlation (r)
- -0.5933
- Spearman correlation
- -0.6047
- p-value
- 0
- Sample size (n)
- 250
- 95% confidence interval
- -0.6681 to -0.5065
- Granger causality
- None
- Granger optimal lag
- 1
AI analysis
Scatterplot Analysis: 5-Year Breakeven Inflation Rate vs. Cboe U.S. Equities Market Volume (2014)
Relationship Overview
The scatterplot reveals a moderate negative relationship between U.S. equity market trading volume (X-axis) and the 5-year breakeven inflation rate (Y-axis) across 2014. As daily market volume increases, inflation expectations tend to decline, tracing a downward-sloping linear trend captured by the regression equation y = -5.54×10⁻⁹x + 2.14. This inverse pattern suggests that periods of unusually high trading activity in U.S. equities coincided with suppressed or falling inflation expectations during this year. The relationship is visually apparent in the data cloud, with lower-volume days clustering around higher breakeven rates (roughly 1.75–2.05) and higher-volume days associated with notably lower rates (1.17–1.45).
Correlation Strength and Statistical Framing
The Pearson correlation of r = -0.593 indicates a moderate negative association, and the R² of 0.352 means that roughly 35.2% of the variance in the breakeven inflation rate is statistically explained by trading volume — a meaningful but far from complete relationship, leaving nearly two-thirds of variance attributable to other factors. The 95% confidence interval of [-0.668, -0.507] is reassuringly narrow given the sample size (n = 250), and the p-value of effectively zero confirms this is not a chance finding within the sample. However, the Granger causality results tell a critically different story: neither direction (X→Y nor Y→X) achieves significance (F = 0.0005, p = 0.98 and F = 0.717, p = 0.40, respectively). This means that despite the strong contemporaneous correlation, neither variable reliably predicts the other in the next time period, undermining any claim of a directional or causal mechanism between them.
Patterns, Clusters, and Outliers
The data cloud shows a relatively tight central cluster between approximately 50–90 million shares in volume and 1.60–2.05 on the inflation rate, where the bulk of typical trading days reside. A distinct lower-right cluster of outliers is visible at extreme volumes (roughly 155–196 million), corresponding to breakeven rates near or below 1.25 — these high-volume, low-inflation-expectation days appear to exert considerable leverage on the regression slope and likely correspond to specific market stress events in late 2014 (e.g., oil price collapse-related volatility in Q4). There is also noticeable vertical spread at moderate volume levels (60–85 million), suggesting that volume alone provides weak day-to-day predictive power in that range despite the overall trend.
Confounding Factors and Caveats
Several important caveats apply. First, the axis labels appear swapped relative to the dataset descriptions — the X-axis is labeled as the breakeven inflation rate column from the Cboe dataset, and the Y-axis from the FRED dataset, which warrants careful verification before drawing conclusions. Second, both variables are time-indexed daily series in 2014, meaning autocorrelation and shared temporal trends (e.g., a common response to the Q4 2014 oil shock or Federal Reserve communications) could be driving the observed correlation spuriously — both series may simply be independently reacting to the same macroeconomic shock rather than influencing each other. Third, the N = 3,686 population figure versus n = 250 sample raises questions about the sampling design and generalizability. Finally, the linear model may be oversimplified; the high-volume outliers suggest possible threshold or regime-based dynamics.
Actionable Insights and Further Investigation
Given the absence of Granger causality, practitioners should not use trading volume as a leading signal for inflation expectations (or vice versa), despite the tempting contemporaneous correlation. A productive next step would be to decompose the data into pre- and post-Q4 2014 regimes to test whether the correlation is largely an artifact of the oil-driven volatility spike. Researchers should also control for the VIX or other volatility measures, as elevated equity market volume and falling inflation expectations may both be downstream effects of risk-off sentiment rather than related to each other structurally. A rolling-window correlation analysis across the year could reveal whether the relationship is stable or concentrated in specific episodes, and testing with non-linear or piecewise regression may better capture the apparent threshold behavior at extreme volume levels.
X dataset: Cboe U.S. Equities Historical Market Volume Data 2014
Y dataset: FRED – 5-Year Breakeven Inflation Rate
Part of experiment: Daily - Cboe U.S. Equities Historical Market Volume Data 2014 vs FRED – 5-Year Breakeven Inflation Rate