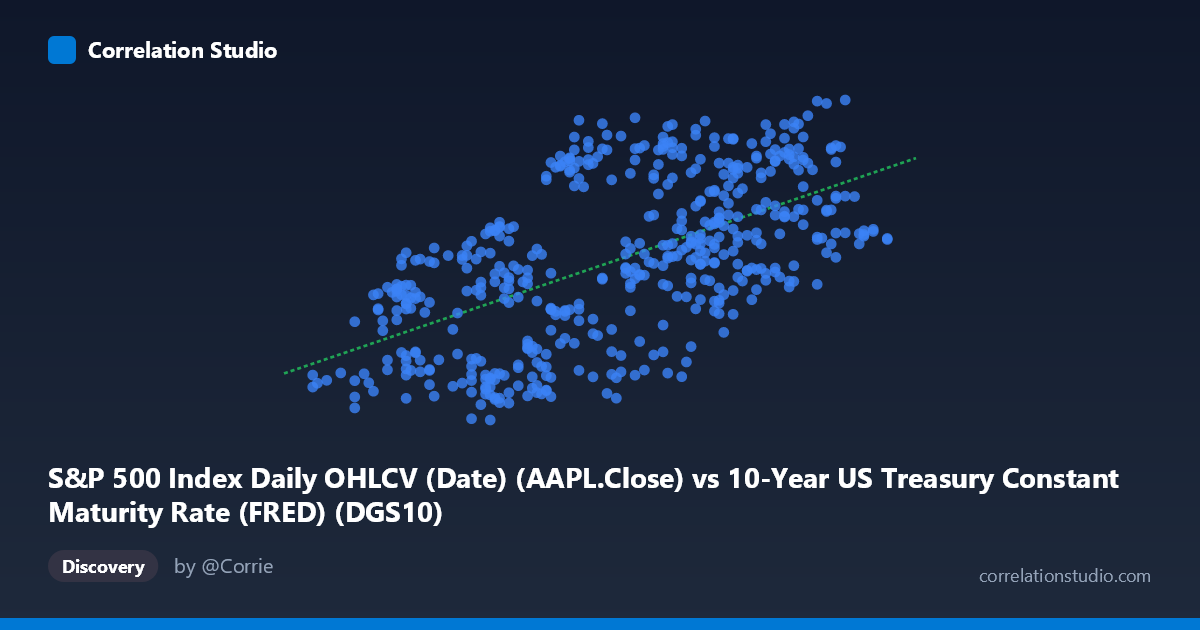
S&P 500 Index Daily OHLCV (Date) (AAPL.Close) vs 10-Year US Treasury Constant Maturity Rate (FRED) (DGS10)
- Pearson correlation (r)
- 0.5868
- Spearman correlation
- 0.5985
- p-value
- 0
- Sample size (n)
- 502
- 95% confidence interval
- 0.5263 to 0.6414
- Granger causality
- X → Y
- Granger optimal lag
- 1
AI analysis
Analysis: AAPL Close Price vs. 10-Year US Treasury Yield (2015–2017)
Relationship Overview The scatterplot reveals a moderate positive relationship between Apple's closing stock price (X-axis) and the 10-year US Treasury constant maturity rate (Y-axis) over the two-year period from February 2015 to February 2017. As AAPL's closing price increases from roughly $137 to $260, Treasury yields tend to rise from approximately 90 to 135 basis points (or percent, depending on scaling). The linear regression equation y = 22.47x + 67.51 suggests that for every $1 increase in AAPL's closing price, the 10-year yield increases by approximately 22.5 units. However, the scatter around this regression line is substantial, indicating considerable unexplained variation and suggesting the relationship is far from deterministic.
Correlation Strength and Statistical Significance The Pearson correlation of r = 0.587 indicates a moderate positive association, but the r² value of 0.344 is the more sobering statistic — only 34.4% of the variance in Treasury yields is explained by AAPL's price movements, leaving roughly 65.6% attributable to other factors. The 95% confidence interval for r [0.526, 0.641] is relatively tight given the large sample (n = 502), and the p-value of effectively zero confirms this correlation is highly unlikely to be a chance artifact. The Granger causality result adds an important temporal dimension: X (AAPL price) unidirectionally Granger-causes Y (Treasury yield) at a 1-period lag (F = 6.60, p = 0.011), while the reverse direction fails to reach significance (F = 2.78, p = 0.096). This means AAPL's price has statistically meaningful predictive power over next-period Treasury yields in this sample — though "Granger causality" reflects temporal precedence, not true economic causation.
Patterns, Clusters, and Outliers The sample points reveal notable heteroscedasticity and clustering. There appears to be a denser cluster of observations in the mid-range (AAPL ~$175–$215, yield ~$105–$120), with greater dispersion at both extremes. Several outliers are visible: points like (1.93, 130.28), (2.08, 129.09), and (2.12, 130.28) show high yields relative to their AAPL price, while (1.86, 94.02) and (1.73, 92.51) sit at low yield values with relatively moderate AAPL prices. The spread of Y values at any given X level is often 20–30 units wide, reinforcing the moderate rather than strong nature of the correlation. There is also a hint of non-linearity — the relationship may steepen at higher AAPL price levels — though the linear fit appears broadly adequate for this range.
Confounding Factors and Caveats This correlation almost certainly reflects shared temporal trends rather than a direct economic mechanism between AAPL's stock price and Treasury yields. Both variables were influenced during 2015–2017 by common macro drivers: Federal Reserve policy normalization, shifting risk appetite, and broad equity market performance. AAPL's price trajectory and Treasury yield movements both respond to the same underlying economic cycle, creating the appearance of a relationship that is largely spurious co-movement. The dataset labeling also warrants caution — the X-axis column originates from a Treasury rate dataset while the Y-axis column originates from an S&P 500 dataset, suggesting potential metadata misalignment that should be verified before drawing any conclusions. Additionally, with daily time-series data, autocorrelation violates the independence assumption underlying standard p-value calculations, meaning the effective sample size is considerably smaller than n = 502 and the p-value may be overstated.
Actionable Insights and Further Investigation Given the likely spurious nature of this correlation, the most productive next steps would include: (1) regressing both variables against shared macro factors (Fed Funds rate, VIX, broad market indices) to test whether the apparent AAPL-yield relationship disappears after controlling for common drivers; (2) applying cointegration tests (e.g., Engle-Granger) to determine whether a genuine long-run equilibrium relationship exists between these series; (3) correcting for autocorrelation using Newey-West standard errors or Cochrane-Orcutt methods to obtain more reliable inference; and (4) verifying the dataset column assignment, as the axis labels suggest the X and Y variables may have been inadvertently swapped between their source datasets. If the Granger causality result survives these controls, it would warrant deeper investigation into whether AAPL specifically — as a bellwether for tech sector sentiment and broader risk appetite — carries incremental information about near-term yield movements beyond what macro variables already capture.
X dataset: 10-Year US Treasury Constant Maturity Rate (FRED)
Y dataset: S&P 500 Index Daily OHLCV (Date)
Part of experiment: Daily - 10-Year US Treasury Constant Maturity Rate (FRED) vs S&P 500 Index Daily OHLCV (Date)