CryptoDataDownload – Bitstamp BTC/USD Daily OHLCV (open) vs Bitcoin Historical Price USD – All-Time Series (Habrador) (Price)
- Pearson correlation (r)
- 0.9995
- Spearman correlation
- 0.9997
- p-value
- 0
- Sample size (n)
- 4170
- 95% confidence interval
- 0.9995 to 0.9996
- Granger causality
- None
- Granger optimal lag
- 10
AI analysis
Analysis: Bitcoin Price Series Correlation (Habrador Open vs. Bitstamp Open)
1. What the Visualization Reveals
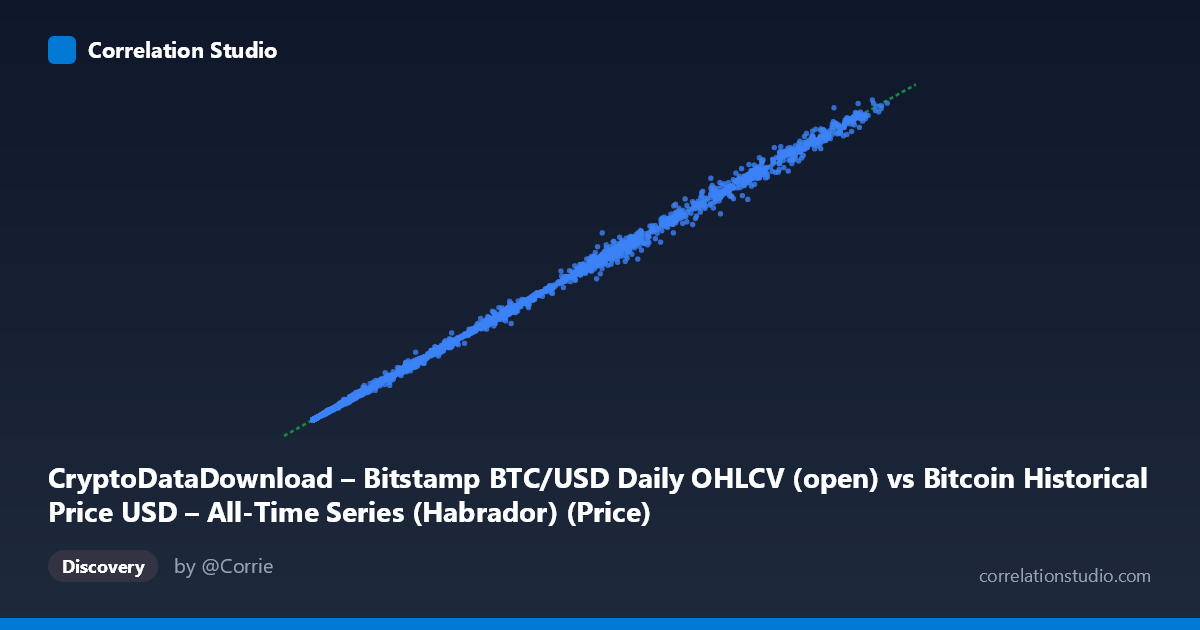
The scatterplot shows an almost perfectly linear relationship between two Bitcoin price series spanning from under $200 to over $124,000. Points hug a 45-degree line (slope = 0.9988, intercept ≈ 11.3) across the entire price range, from early-era sub-$1,000 prices through the multi-thousand-dollar and eventual six-figure price regimes. The tight clustering at every price magnitude—visible in the sample points (e.g., 288.52↔274.89, 101240↔99969, 68508.84↔65984)—indicates the relationship holds consistently whether Bitcoin is trading at $200 or $100,000+.
2. Strength, Direction, and Statistical Meaning
With r = 0.9995 and r² = 0.9991, these two series share 99.91% of their variance—essentially the same underlying signal measured twice. The 95% CI [0.9995, 0.9996] is extremely narrow, and p = 0 confirms this is not a chance artifact even accounting for multiple testing. Practically, this means the two columns are near-duplicates of the same market price, not independent variables with a genuine causal relationship to investigate. The Granger causality results reinforce this: neither series significantly predicts the other (p = 0.338 and p = 0.352), which makes sense if both are contemporaneous "open" price quotes from different exchanges/datasets rather than one leading the other in time. There is no exploitable lead-lag structure here.
3. Notable Patterns and Outliers
The relationship appears log-linear in nature (or linear across log-price space), typical of financial asset prices with exponential growth trends. A few sample points show mild divergence at higher price levels—e.g., (68508.84, 65984.00) is a ~4% deviation, and (55027.46, 56048.00) and (42848.18, 44972.00) show ~2-5% gaps—suggesting slightly larger absolute (though not necessarily relative) discrepancies during high-volatility periods or possibly around specific dates where Bitstamp and the broader "all-time" aggregated series diverge (exchange-specific premiums/discounts, flash crashes, or data-source timing differences). No evidence of clustering by regime or structural breaks is apparent from the samples—the fit is stable across low and high price bands alike.
4. Confounding Factors and Caveats
The critical caveat is that these are likely two overlapping measurements of the same underlying asset price, not two economically distinct variables. Bitstamp is one of several exchanges feeding into aggregated "all-time" Bitcoin price datasets, so the Habrador series may partially or wholly source its data from Bitstamp or a blend including Bitstamp. This creates a near-tautological correlation rather than a meaningful discovery about market dynamics. Minor deviations likely stem from: (a) different data vendors/aggregation methodologies (e.g., volume-weighted average vs. single-exchange open), (b) timestamp/timezone misalignment (daily "open" defined differently), or (c) missing-data handling differences (N=4,228 vs. n=4,170 paired points suggests ~58 points didn't align, possibly early history where Bitstamp didn't yet exist).
5. Actionable Insights and Further Investigation
Given the near-identical nature of these series, this pairing is better suited for data validation/reconciliation than causal or predictive modeling. Suggested next steps: (1) investigate the ~58 unmatched points and the early period before Bitstamp launched, to understand how the Habrador dataset sourced pre-2011 data; (2) examine the specific dates behind the larger deviations (e.g., the 4-5% gaps) to check if they align with known flash-crash events, exchange outages, or reporting-lag artifacts; (3) if the goal is genuine cross-market analysis, compare Bitstamp against a truly independent exchange (e.g., Coinbase, Kraken) rather than an aggregate that likely includes Bitstamp; and (4) use this pair primarily as a sanity-check/calibration benchmark for merging multi-source historical crypto datasets, not as evidence of a substantive economic relationship.
X dataset: Bitcoin Historical Price USD – All-Time Series (Habrador)
Y dataset: CryptoDataDownload – Bitstamp BTC/USD Daily OHLCV
Part of experiment: Bitcoin - Bitcoin Historical Price USD – All-Time Series (Habrador) vs CryptoDataDownload – Bitstamp BTC/USD Daily OHLCV