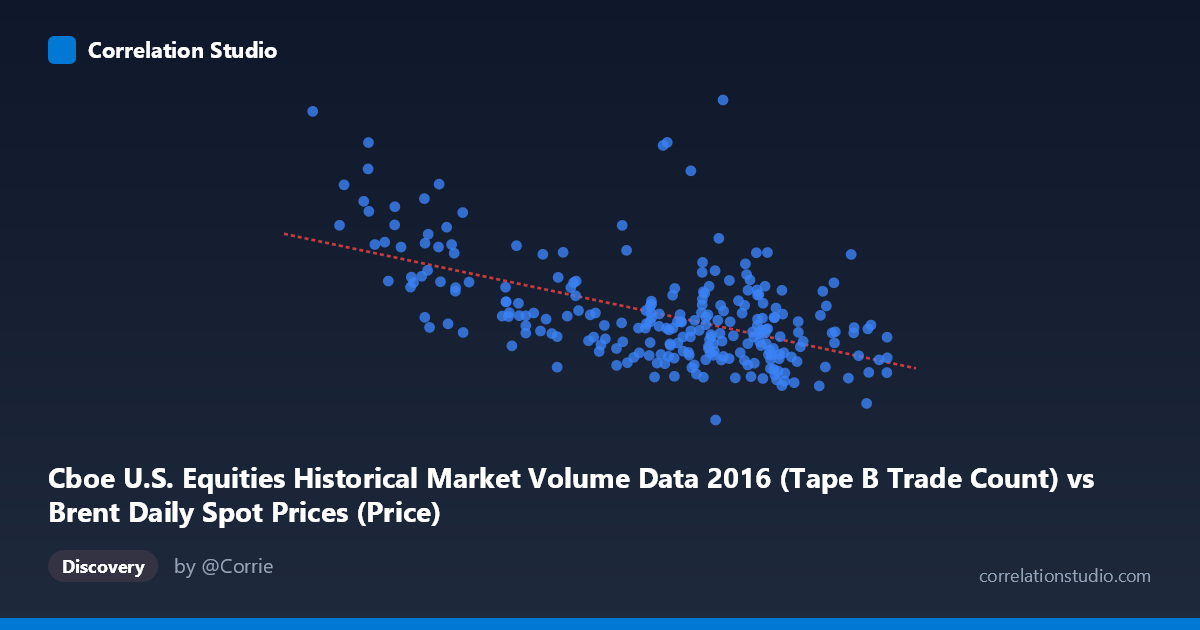
Cboe U.S. Equities Historical Market Volume Data 2016 (Tape B Trade Count) vs Brent Daily Spot Prices (Price)
- Pearson correlation (r)
- -0.5472
- Spearman correlation
- -0.4797
- p-value
- 0
- Sample size (n)
- 251
- 95% confidence interval
- -0.6285 to -0.4542
- Granger causality
- None
- Granger optimal lag
- 10
AI analysis
Analysis: Brent Crude Oil Prices vs. Cboe Tape B Trade Count (2016)
Relationship Overview The scatterplot reveals a moderate negative relationship between Cboe U.S. Equities Tape B trade count and Brent crude oil daily spot prices across 2016. As equity trade volume increases, oil prices tend to decline — a pattern that is visually discernible in the downward-sloping regression line (y = -7,765.19x + 658,900). This inverse relationship is intuitively plausible: elevated equity trading activity may reflect periods of risk-on market sentiment or volatility, which can correlate with commodity market dynamics, though the mechanism is not straightforward. The data spans a full calendar year (January to December 2016), capturing a period when Brent crude was recovering from historic lows.
Correlation Strength and Statistical Significance The Pearson correlation of r = -0.547 indicates a moderate negative association, but the explanatory power is notably limited — r² = 0.30 means only ~30% of the variance in Brent prices is explained by Tape B trade count, leaving 70% attributable to other factors. The 95% confidence interval of [-0.629, -0.454] is reasonably tight and does not cross zero, and the p-value of effectively 0 confirms the result is statistically significant given the large population (N = 3,622). However, statistical significance here is partly a function of sample size rather than effect strength alone. Critically, Granger causality tests find no significant predictive direction in either direction (X→Y: F = 0.71, p = 0.71; Y→X: F = 0.69, p = 0.74), meaning that past values of either variable do not meaningfully predict future values of the other at the optimal 10-period lag. This firmly suggests correlation without temporal predictive utility.
Patterns, Clusters, and Outliers The sample points reveal notable heterogeneity. Several prominent outliers are visible in the lower-left and upper-left regions: points like (26.01, 693,228) and (27.59, 558,190) exhibit very low trade counts paired with high oil prices, anchoring the negative trend but also inflating it. Conversely, higher trade count values (48–53 range) cluster around moderate oil prices (200,000–350,000 range) with considerable vertical scatter, suggesting the relationship weakens at higher volume levels. The spread around the regression line is substantial throughout, and there is visible heteroscedasticity — variance in Y appears larger at lower X values — which challenges the assumptions of simple linear regression and may reduce the model's reliability.
Confounding Factors and Caveats Several confounding factors complicate interpretation. First, 2016 was an anomalous year for both markets: Brent crude rebounded from sub-$30 levels early in the year following OPEC production discussions, while equity volumes were influenced by Brexit, the U.S. presidential election, and Fed rate decisions — all independent macro shocks affecting both variables simultaneously. Second, the dataset pairing itself raises a conceptual flag: the X-axis column ("Tape B Trade Count") originates from the Brent dataset file, and the Y-axis ("Price") from the Cboe dataset, suggesting possible data join artifacts or labeling inconsistencies that warrant verification before drawing conclusions. Third, the negative correlation may be a spurious byproduct of shared time trends rather than any genuine economic linkage.
Actionable Insights and Further Investigation Given the absence of Granger causality, practitioners should not use Tape B trade volume as a leading indicator for Brent price forecasting. However, the moderate correlation warrants deeper investigation into shared macroeconomic drivers — such as VIX levels, USD index movements, or risk sentiment indices — that may be driving both variables simultaneously. A multivariate regression incorporating macro controls (e.g., dollar strength, equity volatility) would help isolate the net effect of trade volume on oil prices. Additionally, applying rolling-window correlation analysis across sub-periods of 2016 could reveal whether the relationship strengthens during specific macro events (e.g., OPEC meetings, election period). Finally, resolving the apparent dataset column origin discrepancy should be the first practical step before any operational use of this analysis.
X dataset: Brent Daily Spot Prices
Y dataset: Cboe U.S. Equities Historical Market Volume Data 2016
Part of experiment: Daily - Brent Daily Spot Prices vs Cboe U.S. Equities Historical Market Volume Data 2016