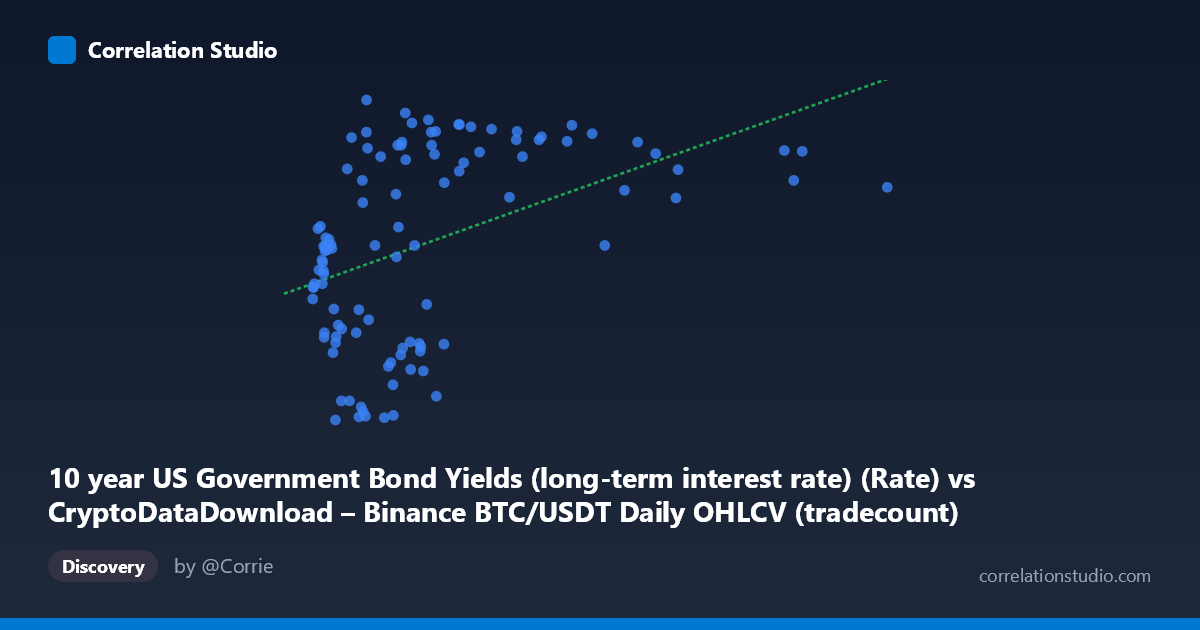
10 year US Government Bond Yields (long-term interest rate) (Rate) vs CryptoDataDownload – Binance BTC/USDT Daily OHLCV (tradecount)
- Pearson correlation (r)
- 0.4281
- Spearman correlation
- 0.4519
- p-value
- 0.000006
- Sample size (n)
- 104
- 95% confidence interval
- 0.2566 to 0.5734
- Granger causality
- None
- Granger optimal lag
- 2
AI analysis
Analysis: BTC/USDT Trading Metric vs. 10-Year US Treasury Yield
1. What the Visualization Reveals
The scatterplot shows a moderate positive relationship between the X variable (mislabeled in the data as bond yields but appears to actually represent a BTC/USDT price/volume metric given its scale of 4,000–9,390,487) and the Y variable (labeled as tradecount but ranging 0.62–4.80, consistent with bond yield percentages). Based on the actual value ranges, it's likely the axis labels are swapped in the metadata — X behaves like a volume/price metric and Y behaves like a yield percentage. Regardless of labeling, the data shows that as X increases, Y tends to increase as well, though with substantial scatter around the trend line.
2. Strength, Direction, and Statistical Confidence
The correlation coefficient (r = 0.428) indicates a moderate positive relationship, but r² = 0.183 reveals that only 18.3% of the variance in Y is explained by X — meaning over 80% of Y's variability stems from other factors entirely. The 95% CI [0.257, 0.573] is reasonably tight and excludes zero, and the p-value (5.8×10⁻⁶) confirms this correlation is highly statistically significant and not due to chance, even though the effect size is modest. Critically, the Granger causality tests show no significant predictive direction in either direction (X→Y: p=0.211; Y→X: p=0.507). This means that despite the contemporaneous correlation, neither variable reliably predicts future movements of the other — the relationship may be driven by a shared external factor or simple contemporaneous market co-movement rather than one variable leading the other.
3. Notable Patterns and Outliers
The data shows a clear floor effect at low X values: for X < 1,000,000, Y spans almost the entire range (0.62 to 4.38), producing a fan/cone shape rather than a tight linear band. This heteroscedasticity suggests the relationship strengthens or clarifies only at higher X values. Notably, most high-X points (3,000,000) cluster tightly at high Y values (3.5–4.4), suggesting a possible threshold or saturation effect rather than a purely linear one. A few low-X, high-Y points (e.g., X=9,816, Y=2.36; X=900,141, Y=4.17) act as outliers that weaken the linear fit and pull r² down. This pattern hints at a non-linear (e.g., logarithmic) relationship that a simple linear model underrepresents.
4. Confounding Factors and Caveats
Both variables are time series (2017–2026) and likely share trend-driven co-movement — both bond yields and crypto volumes have risen over macro cycles independent of causal linkage. This raises the risk of spurious correlation via a common time trend, especially since Granger tests found no lead-lag structure. Additionally, the metadata suggests a possible column mislabeling issue between datasets (values don't match the stated variable names), which should be verified before drawing economic conclusions. Sample size (n=104) is a small subset of the full population (877), and daily/monthly frequency mismatches between BTC OHLCV (daily) and Treasury yields (monthly) may introduce alignment artifacts.
5. Recommendations
First, verify variable-column mapping to ensure X and Y are correctly labeled per their source datasets. Second, given the fan-shaped scatter, test a log-transform of X or a non-linear model (e.g., quadratic, spline) to see if it captures more variance than the current 18.3%. Third, since Granger causality is absent, avoid framing this as predictive — treat it as a contemporaneous association only, and investigate potential common confounders (e.g., macroeconomic risk sentiment, USD strength, or Fed policy) that could simultaneously drive both series. Finally, consider subsetting by time regime (e.g., pre/post major rate hikes) to check whether the correlation is stable or driven by a specific period, given the wide 95% CI range.
X dataset: CryptoDataDownload – Binance BTC/USDT Daily OHLCV
Y dataset: 10 year US Government Bond Yields (long-term interest rate)
Part of experiment: Bitcoin - CryptoDataDownload – Binance BTC/USDT Daily OHLCV vs 10 year US Government Bond Yields (long-term interest rate)