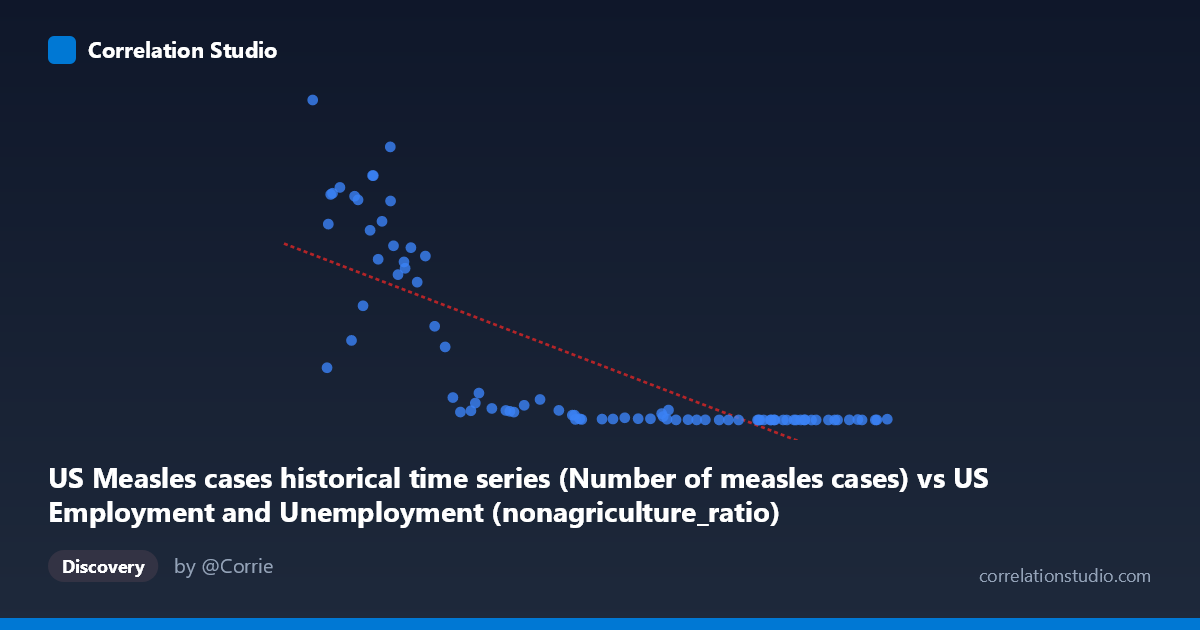
US Measles cases historical time series (Number of measles cases) vs US Employment and Unemployment (nonagriculture_ratio)
- Pearson correlation (r)
- -0.777
- Spearman correlation
- -0.9115
- p-value
- 0
- Sample size (n)
- 85
- 95% confidence interval
- -0.8495 to -0.6758
- Granger causality
- None
- Granger optimal lag
- 10
AI analysis
Analysis: US Measles Cases vs. Non-Agriculture Employment Ratio
1. Overall Relationship Revealed
The scatterplot reveals a striking negative relationship between historical US measles case counts (X-axis) and the non-agriculture employment ratio (Y-axis), spanning data from 1941 to 2025. Years with very high measles case counts (roughly 40,000–65,000) correspond to dramatically elevated non-agriculture ratios (often exceeding 400,000–800,000+), while years with lower measles counts (above ~100,000 on the X scale, noting the axis represents raw case numbers) tend to cluster near very low Y values. The visual pattern is not a clean straight line but rather a sharply curved, hyperbolic sweep — data points cascade steeply downward from the upper-left toward a dense cluster hugging the bottom-right, suggesting a strongly non-linear, likely exponential or logarithmic decay relationship between the two variables.
2. Correlation Strength, Direction, and Statistical Framing
The Pearson correlation of r = -0.777 indicates a strong negative linear association, and the R² of 0.604 means approximately 60.4% of the variance in the non-agriculture ratio is statistically "explained" by variation in measles case counts within this linear model. The 95% confidence interval of [-0.850, -0.676] is notably tight and sits entirely in negative territory, and the p-value of essentially zero confirms this association is highly unlikely to be a chance artifact in the sample. However, the note that Spearman ρ exceeds Pearson r is critical — it signals that the linear model is understating the true monotonic strength of the relationship, and a logarithmic or power-law transformation would likely yield an even higher explained variance. The Granger causality results tell an equally important story: neither direction (X→Y nor Y→X) reaches statistical significance (F = 1.54, p = 0.151 for X→Y; F = 1.40, p = 0.203 for Y→X), meaning that even with an optimal lag of 10 periods, past measles case counts do not significantly predict future non-agriculture employment ratios, and vice versa. This effectively rules out any meaningful temporal predictive relationship between these two series.
3. Notable Patterns, Clusters, and Outliers
Three distinct structural features dominate the scatterplot. First, there is a tight, dense cluster of points at very low Y values (near zero) spanning the middle-to-high X range (~90,000–161,000), representing the post-vaccination era when measles cases dropped dramatically and the employment metric stabilized. Second, a high-leverage upper-left arm of points — including the extreme outlier at approximately (41,250; 894,134) — corresponds to pre-vaccination decades when measles was endemic and case counts were enormous. Third, there appear to be a handful of intermediate transitional points in the (50,000–75,000 X range) with moderately high Y values (200,000–700,000), likely capturing the 1960s transition period around vaccine introduction. The outlier at (41,250; 894,134) exerts substantial influence on the regression line and correlation coefficient and likely corresponds to a peak measles year in the early 1940s. The hyperbolic curvature strongly suggests that a log-log or semi-log transformation would linearize the relationship far more faithfully than the current linear model.
4. Confounding Factors and Interpretive Caveats
The most fundamental caveat here is that this correlation almost certainly reflects shared temporal trends rather than any causal mechanism. Both variables are annual time series from roughly 1941–2025, and both underwent dramatic structural shifts during the same era: measles cases plummeted following vaccine introduction in 1963–1968, while US labor market composition shifted profoundly toward non-agricultural employment across the same post-war decades driven by industrialization, suburbanization, and service-sector growth. This is a textbook example of spurious correlation via common time trend — two independently evolving series that happen to move in opposite directions over the 20th century. Additional confounders include population growth (affecting raw case counts), changes in disease reporting methodology, economic recessions and expansions (affecting employment ratios), and the broadening of non-agricultural job classifications over time. The Granger causality null results reinforce that there is no plausible mechanism linking measles incidence to employment structure in any predictive sense.
5. Actionable Insights and Further Investigation
Given the non-linearity flagged by the Spearman-Pearson divergence, the immediate analytical priority should be re-fitting the model on log-transformed Y (or both variables), which would likely yield a substantially improved R² and a more interpretable regression coefficient. Researchers should also explicitly detrend both time series — removing the shared secular trend using differencing, polynomial detrending, or cointegration methods — to assess whether any residual relationship persists after common temporal drift is removed; the strong prior expectation is that the correlation would largely or entirely disappear. It would be valuable to test structural breakpoints around 1963–1968 (vaccine introduction) to confirm whether the relationship differs meaningfully between pre- and post-vaccine eras. Finally, if the underlying research question involves measles vaccination impact, a more defensible analytical approach would pair measles cases with vaccination coverage rates or public health expenditure data rather than an unrelated labor market metric, and if employment-health relationships are of interest, direct health outcome variables would provide more mechanistically coherent comparisons.
X dataset: US Employment and Unemployment
Y dataset: US Measles cases historical time series
Part of experiment: Yearly - US Employment and Unemployment vs US Measles cases historical time series