FRED: Telecom & Internet Service Provider Employment (NAICS 5171/5172) (CES5051100001) vs Bitcoin Historical Price USD – All-Time Series (Habrador) (Price)
- Pearson correlation (r)
- 0.7358
- Spearman correlation
- 0.8401
- p-value
- 0
- Sample size (n)
- 189
- 95% confidence interval
- 0.6627 to 0.795
- Granger causality
- None
- Granger optimal lag
- 9
AI analysis
Analysis: Bitcoin Price vs. Telecom Employment
1. What the Visualization Reveals
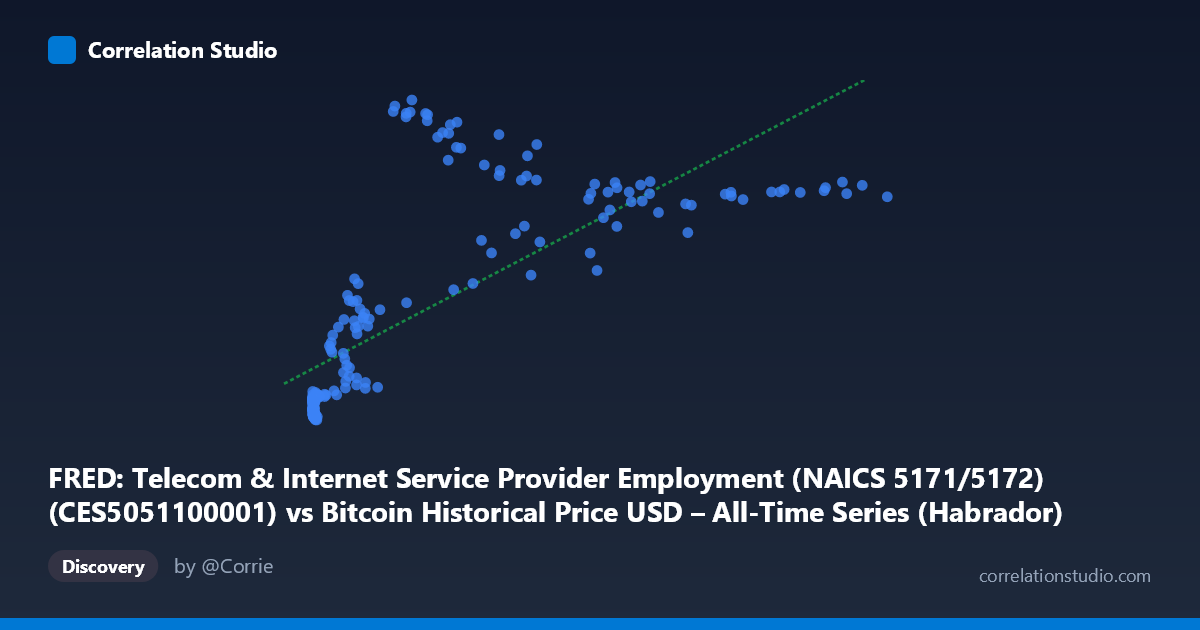
The scatterplot shows a clear positive, non-linear relationship between Bitcoin's historical price (X-axis) and telecom/ISP employment levels (Y-axis). At low Bitcoin prices (under ~$1,000), the Y values cluster tightly in a narrow band (roughly 760–780), indicating telecom employment was relatively flat during Bitcoin's early history. As Bitcoin prices climb into the tens of thousands, Y values rise more steeply and spread out more widely (830–965), suggesting the relationship strengthens or accelerates at higher X values rather than following a straight line throughout.
2. Strength, Direction, and Uncertainty
The Pearson correlation (r = 0.736, r² = 0.541) indicates a moderately strong positive association, with about 54% of the variance in telecom employment statistically explained by Bitcoin price levels. The 95% CI [0.663, 0.795] is reasonably tight and excludes zero, and the p-value is effectively 0, confirming this correlation is highly unlikely to be due to chance given the sample. However, correlation here should not be read as causation: the Granger causality tests show no significant predictive direction in either direction (Bitcoin→Employment: p=0.35; Employment→Bitcoin: p=0.69). This strongly suggests both series are independently trending upward over the same calendar period (2010–2026) rather than one driving the other in a temporal, forecastable sense.
3. Notable Patterns and Non-linearity
The data show a compressed cluster of low-X points (Bitcoin under $1,000) with Y values in a tight 760–780 range — this represents Bitcoin's early years (2010–2013) when telecom employment was stable. Beyond ~$5,000, the relationship becomes more scattered and steeper, with some interesting local structure: e.g., points near X=45,000 show Y dipping to 853 while points near X=23,700–29,700 show Y spiking to 927–957, suggesting Y is not monotonic with X but instead driven by its own trend (time) that happens to coincide with certain Bitcoin price ranges. The note that Spearman ρ exceeds Pearson r confirms a monotonic but curved (likely logarithmic) relationship — consistent with Bitcoin's exponential/log-scale price behavior compressing early data and stretching later data.
4. Confounding Factors and Caveats
The most obvious confound is shared time trend: both series span 2010–2026, and telecom employment has structural drivers (broadband expansion, 5G buildout, COVID-era hiring/layoffs, AI infrastructure growth) entirely unrelated to cryptocurrency prices. Bitcoin's price is also highly volatile and speculative, while employment data is smoothed/monthly and slow-moving — pairing a fast-moving financial asset with a slow labor-market series over the same calendar window will almost always produce spurious correlation due to co-trending, especially given N=437 population vs. n=189 sampled (survivorship/alignment effects in the merge should be checked). The lack of Granger causality reinforces that this is very likely a spurious/confounded correlation driven by mutual dependence on time, not a genuine economic linkage.
5. Actionable Insights
Given the absence of Granger causality, this correlation should not be used for predictive or trading purposes linking telecom hiring to Bitcoin price (or vice versa). For further investigation: (a) de-trend both series (e.g., first-difference or detrend against time) and re-test correlation to isolate any genuine co-movement beyond shared trend; (b) fit a log-linear or polynomial model on X given the Spearman/Pearson divergence, which should improve R² and better reflect Bitcoin's log-scale growth; (c) explore alternative confounders like overall tech-sector employment, GDP, or internet adoption rates as a more plausible shared driver. Treat the current r² of 0.54 as an artifact of common temporal trend rather than a meaningful economic relationship.
X dataset: Bitcoin Historical Price USD – All-Time Series (Habrador)
Y dataset: FRED: Telecom & Internet Service Provider Employment (NAICS 5171/5172)
Part of experiment: Bitcoin - Bitcoin Historical Price USD – All-Time Series (Habrador) vs FRED: Telecom & Internet Service Provider Employment (NAICS 5171/5172)