Cboe U.S. Equities Historical Market Volume Data 2020 (Tape B Shares) vs Brent Daily Spot Prices (Price)
- Pearson correlation (r)
- -0.4616
- Spearman correlation
- -0.4906
- p-value
- 0
- Sample size (n)
- 250
- 95% confidence interval
- -0.5539 to -0.358
- Granger causality
- None
- Granger optimal lag
- 10
AI analysis
Analysis: Brent Crude Oil Prices vs. Cboe Tape B Equity Trading Volume (2020)
Relationship Overview
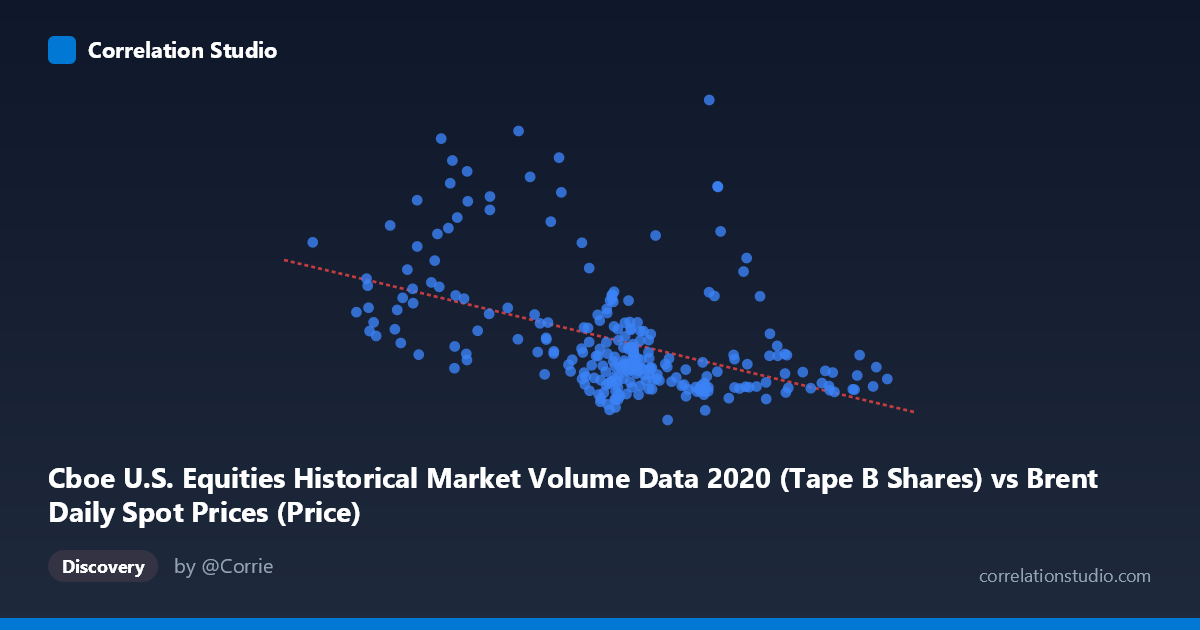
The scatterplot reveals a moderate negative relationship between Cboe U.S. Equities Tape B share volume (X-axis) and Brent crude oil spot prices (Y-axis) across 2020 trading days. The linear regression equation (y = -2,087,130x + 207,189,000) indicates that as equity trading volume increases, oil prices tend to decrease — roughly $2.09 million drop in the price-scaled Y variable per unit increase in X. Visually, the data points show a discernible downward trend, though with substantial scatter around the regression line, suggesting the relationship is real but far from deterministic. The cloud of points spans a wide range, particularly on the Y-axis, hinting at considerable day-to-day variability unexplained by volume alone.
Correlation Strength and Statistical Significance
The Pearson correlation of r = -0.4616 reflects a moderate negative association, but the more informative metric is R² = 0.2131, meaning equity trading volume explains only about 21.3% of the variance in Brent crude prices. The remaining ~79% is attributable to other factors entirely. The 95% confidence interval of [-0.5539, -0.3580] is reasonably narrow and does not include zero, providing solid evidence that the negative correlation is genuine rather than a sampling artifact. The p-value of 1.354×10⁻¹⁴ confirms strong statistical significance at any conventional threshold, lending high confidence to the direction of the correlation given a paired sample of n = 250 from a population of N = 4,254. However, statistical significance must be distinguished from practical significance — a relationship explaining only one-fifth of variance has limited standalone predictive utility.
Granger Causality and Temporal Direction
Despite the statistically significant correlation, Granger causality testing reveals no significant predictive direction in either direction — neither X→Y (F = 0.4736, p = 0.906) nor Y→X (F = 0.2786, p = 0.985) at the optimal 10-period lag. This is a critical finding: it means that past values of Tape B volume do not reliably predict future Brent prices, and vice versa. The two series appear to move together contemporaneously — likely driven by shared external shocks — rather than one leading the other through any causal mechanism. This sharply limits the usefulness of either variable as a forward-looking signal for the other, even though the correlation appears robust in cross-sectional terms.
Notable Patterns, Clusters, and Outliers
Several features stand out in the data. There is a cluster of high-Y, low-to-moderate-X points that visually anchors the negative slope — these likely correspond to early 2020 (January–February) when oil prices were relatively elevated before the COVID-19 demand shock. Conversely, a dense cluster of high-X, low-Y points probably reflects the March–April 2020 period, when pandemic-driven panic simultaneously crashed oil prices and triggered extreme equity trading volumes. A small number of pronounced outliers are visible at very high Y values (approaching 250–340 million), including points near X ≈ 17–18 and X ≈ 35, which likely correspond to specific volatility events (e.g., the historic oil price crash and recovery days in April–May 2020). These outliers exert disproportionate leverage on the regression and may inflate the apparent strength of the correlation.
Confounding Factors and Further Investigation
The most important caveat here is that 2020 was an extraordinary year — the COVID-19 pandemic created simultaneous, correlated shocks across virtually all financial markets, making spurious or crisis-driven correlations far more likely than in normal market conditions. The relationship observed may largely reflect a common driver (pandemic severity and lockdown news) rather than any structural link between equity trading volume and oil prices. Tape B volume specifically captures regional exchange activity, which may not be the most theoretically meaningful counterpart to global oil benchmarks. For further investigation, analysts should: (1) test the relationship across multiple calendar years to assess whether 2020 is anomalous; (2) incorporate explicit COVID-19 event dummies or volatility indices (VIX) as controls; (3) examine intraday or higher-frequency data to identify whether contemporaneous co-movement has a more granular structure; and (4) consider multivariate models incorporating broader equity market volume, dollar index movements, and inventory data to properly isolate any genuine oil-equity volume relationship.
X dataset: Brent Daily Spot Prices
Y dataset: Cboe U.S. Equities Historical Market Volume Data 2020
Part of experiment: Daily - Brent Daily Spot Prices vs Cboe U.S. Equities Historical Market Volume Data 2020