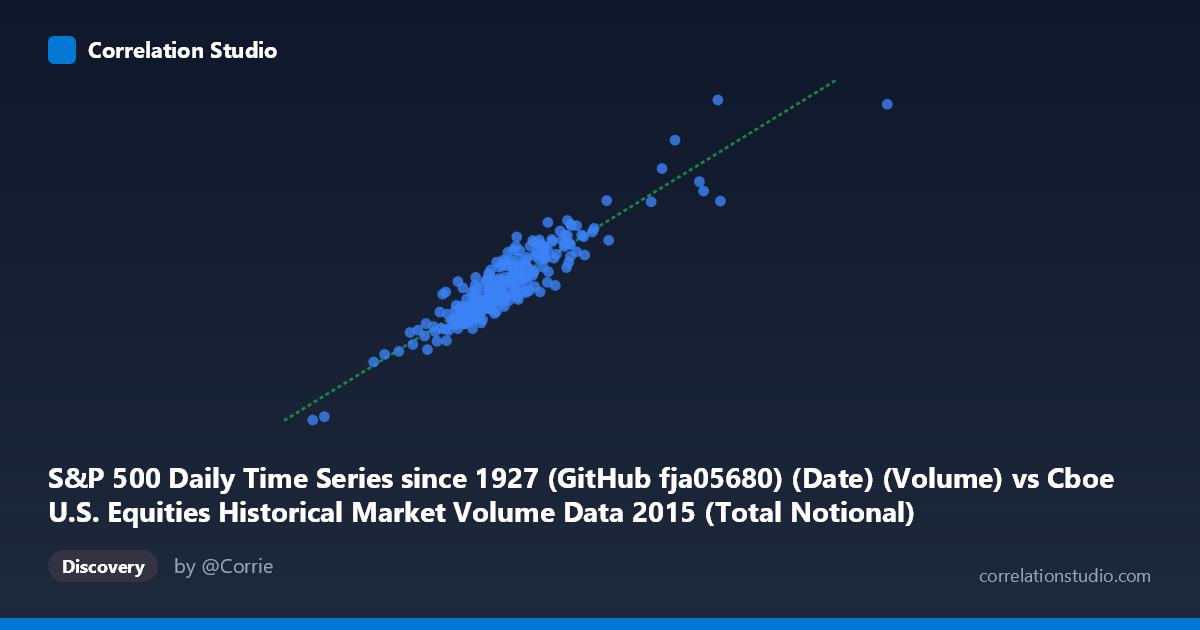
S&P 500 Daily Time Series since 1927 (GitHub fja05680) (Date) (Volume) vs Cboe U.S. Equities Historical Market Volume Data 2015 (Total Notional)
- Pearson correlation (r)
- 0.9208
- Spearman correlation
- 0.8963
- p-value
- 0
- Sample size (n)
- 252
- 95% confidence interval
- 0.8996 to 0.9377
- Granger causality
- None
- Granger optimal lag
- 10
AI analysis
Analysis: S&P 500 Trading Volume vs. Cboe Total Notional Value (2015)
Relationship Overview The scatterplot reveals a strong positive linear relationship between S&P 500 daily trading volume and Cboe U.S. Equities total notional value across 252 trading days in 2015. As daily share volume increases, the total dollar notional value of trades rises commensurately, which is economically intuitive — more shares traded at prevailing prices naturally generates higher aggregate notional value. The data points cluster reasonably tightly around the regression line (y = 0.140x + 6.81×10⁸), suggesting this relationship is consistent and stable across the year, though with meaningful dispersion at higher volume levels.
Correlation Strength and Statistical Significance The correlation is notably strong (r = 0.9208), and the r² of 0.8479 means that approximately 84.8% of the day-to-day variance in total notional value is statistically explained by trading volume alone — a remarkably high figure for financial market data. The 95% confidence interval [0.8996, 0.9377] is narrow and does not approach zero, and the p-value of effectively 0 (against a population of N = 3,302) confirms this is not a chance finding. However, the Granger causality results complicate the interpretive picture: neither direction (X→Y nor Y→X) reaches conventional significance thresholds at the optimal 10-period lag (X→Y: F = 1.53, p = 0.13; Y→X: F = 1.73, p = 0.08). This means that while the two series move together strongly in contemporaneous terms, neither reliably predicts the other's future values — the relationship is synchronous rather than directionally predictive.
Notable Patterns, Clusters, and Outliers The bulk of observations cluster between approximately 15–26 billion in volume and 2.5–4.5 billion in notional value, forming a dense central core consistent with typical 2015 trading conditions. Two visually prominent high-leverage outliers appear in the upper-right quadrant — corresponding to the sample points near (36.8B, 5.0B) and (35.6B, 5.2B) — likely associated with the late-August 2015 market volatility episode (the "China shock" selloff), when both volume and notional values spiked dramatically. At the opposite extreme, the point near (7.2B, 1.4B) is a clear low-volume outlier, possibly a holiday-shortened session. These extreme points likely exercise disproportionate influence on the regression slope and correlation coefficient.
Confounding Factors and Caveats Several important caveats apply. First, price level is an embedded confounder: notional value is mathematically the product of volume and price, so a rising S&P 500 index level during 2015 mechanically inflates notional value independent of any change in volume behavior — the two variables are not fully independent. Second, the datasets appear to be axis-label swapped in the metadata (the X-axis label references "Volume" from the S&P 500 dataset while the Y-axis label references "Total Notional" from the Cboe dataset, yet the column descriptions are cross-attributed), warranting verification of source alignment. Third, intraday composition differences between Cboe-specific notional and broad S&P 500 volume may introduce measurement inconsistencies. Finally, the strong correlation may partly reflect a common driver — market stress or liquidity events — rather than a direct structural link between the two measures.
Actionable Insights and Further Investigation Given the high r² but absent Granger causality, practitioners should avoid using either series as a standalone leading indicator for the other in short-term trading models. Instead, this relationship is better used as a contemporaneous consistency check or regime classifier — days where volume and notional diverge significantly from the regression line may signal unusual price-per-share dynamics worth investigating. Further analysis should: (1) partial out the S&P 500 price level to test whether the residual volume–notional relationship remains strong; (2) segment by volatility regime (e.g., VIX above/below 20) to examine whether the correlation strengthens during stress periods; and (3) extend the time series beyond 2015 to test whether this relationship is stable across different market cycles, given that 2015's China-driven volatility episode may make this year atypically well-correlated.
X dataset: Cboe U.S. Equities Historical Market Volume Data 2015
Y dataset: S&P 500 Daily Time Series since 1927 (GitHub fja05680) (Date)
Part of experiment: Daily - Cboe U.S. Equities Historical Market Volume Data 2015 vs S&P 500 Daily Time Series since 1927 (GitHub fja05680) (Date)