Bitcoin Historical Data (2010-2024) (IssTotNtv) vs CryptoDataDownload – Binance BTC/USDT Daily OHLCV (Volume USDT)
- Pearson correlation (r)
- -0.5759
- Spearman correlation
- -0.7091
- p-value
- 0
- Sample size (n)
- 938
- 95% confidence interval
- -0.6172 to -0.5315
- Granger causality
- None
- Granger optimal lag
- 10
AI analysis
Analysis: Bitcoin Metric Correlation
1. What the Visualization Reveals
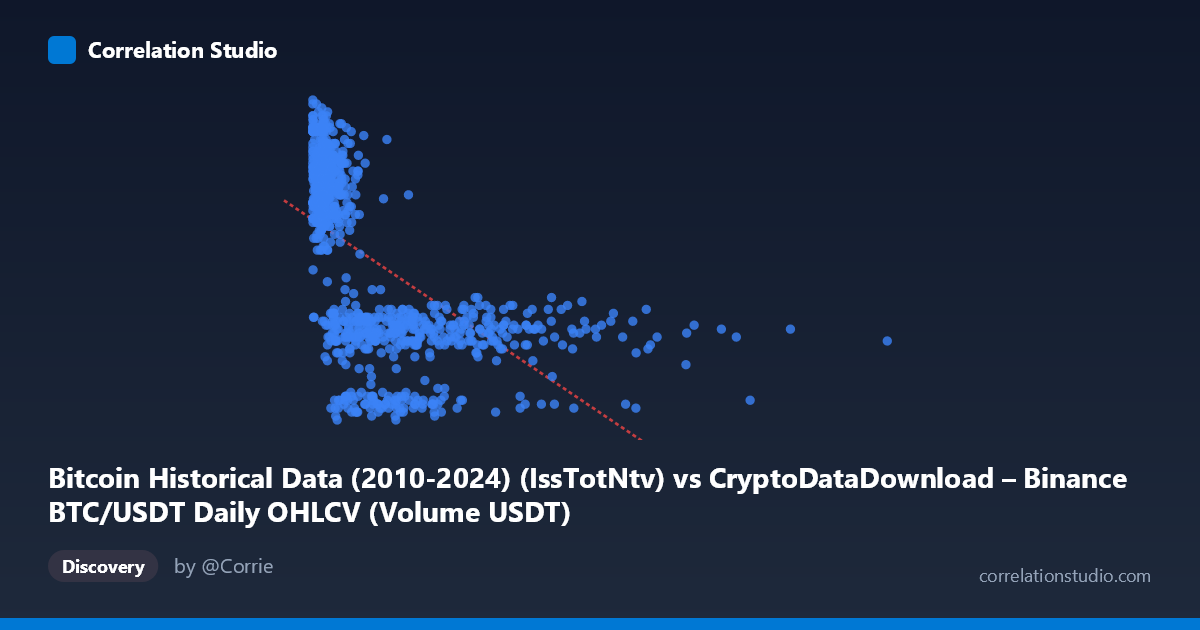
The scatterplot shows a clear inverse relationship between the X variable (labeled as issuance/native units, ranging from ~1.3M to ~12.3B) and Y (volume in USDT, ranging 350–2,375). As X increases across its range, Y systematically declines — high values cluster in the lower-left region (small X, large Y) while the upper-right region (large X) is sparsely populated with only small Y values. The shape is distinctly curved rather than a straight-line decay: Y drops steeply as X rises from near-zero to roughly 1–2 billion, then flattens into a long, low-variance tail as X extends into the billions. This is characteristic of a logarithmic or inverse-power relationship rather than a simple linear one.
2. Strength, Direction, and Uncertainty
The Pearson correlation (r = -0.576, r² = 0.332) indicates a moderate negative linear relationship, explaining about 33% of the variance in Y — meaningful but leaving the majority (67%) unexplained by a linear model. The 95% CI [-0.617, -0.531] is tight and entirely negative, and the p-value ≈ 0 confirms this relationship is highly statistically significant and not due to chance, especially given the large sample (n=938). However, the note that Spearman ρ exceeds Pearson r is important: it signals the true relationship is monotonic but non-linear, meaning a log-transform of X (or a power/log model) would likely explain substantially more variance than the 33% captured here. Critically, the Granger causality tests show no significant predictive direction in either direction (X→Y: p=0.122; Y→X: p=0.757) at a 10-period lag — meaning despite the strong contemporaneous association, neither variable temporally leads the other in a way that's statistically detectable. This suggests the correlation is likely driven by both variables reacting to a shared underlying process (e.g., overall Bitcoin market activity/price cycles) rather than one causing the other.
3. Notable Patterns and Outliers
The data shows a dense cluster of points where X < 1 billion and Y ranges 1,600–2,225 — this appears to be the "normal" operating region. A secondary cluster exists where X is between 2–7 billion, with Y compressed into a narrow 425–1,125 band, showing much lower variance at high X. There's a visible "knee" or inflection point around X ≈ 1–2 billion where the relationship transitions from steep decline to near-flat. No extreme outliers stand out, but the asymmetric spread (wide Y variance at low X, narrow Y variance at high X) suggests heteroscedasticity, which also supports a log/power-law transformation rather than a linear model.
4. Confounding Factors and Caveats
Both variables are derived from the same underlying BTC/USDT market and time series (2017–2026), so they may share common drivers like overall market volatility, bull/bear cycles, or trading volume regimes — this makes the relationship likely spurious or mediated rather than direct causation. The mismatch between the stated N (3,212) and the paired sample n (938) suggests significant missing data or misalignment between the two datasets, which could bias the correlation. Additionally, "IssTotNtv" (total issuance in native units) is an unusual X-axis label for BTC/USDT OHLCV data — it's unclear if this represents cumulative supply, transaction volume, or a mislabeled field, which affects interpretability. Time-scale differences (multi-year span with likely trending values in both series, especially if X resembles cumulative issuance) can also induce spurious correlation via shared trends rather than genuine interaction.
5. Recommendations for Further Investigation
- Re-fit with a log-transformed X (or log-log model) to test whether it substantially improves R², given the Spearman/Pearson discrepancy and visible curvature. - Detrend both series (e.g., difference or de-trend by time) before correlating, to rule out spurious correlation from shared temporal trends — especially important given the multi-year span and no confirmed Granger causality. - Clarify variable definitions: confirm what "IssTotNtv" actually measures and verify the join/alignment logic between the two datasets to explain the N vs. n discrepancy. - Investigate the inflection point (~1–2B on X) with piecewise/segmented regression to characterize the two distinct regimes. - Since Granger causality is insignificant, avoid using this relationship for predictive/trading purposes; treat it as descriptive/correlational only, and look for a third factor (e.g., time, price level, or network activity) that may jointly drive both series.
X dataset: CryptoDataDownload – Binance BTC/USDT Daily OHLCV
Y dataset: Bitcoin Historical Data (2010-2024)
Part of experiment: Bitcoin - CryptoDataDownload – Binance BTC/USDT Daily OHLCV vs Bitcoin Historical Data (2010-2024)