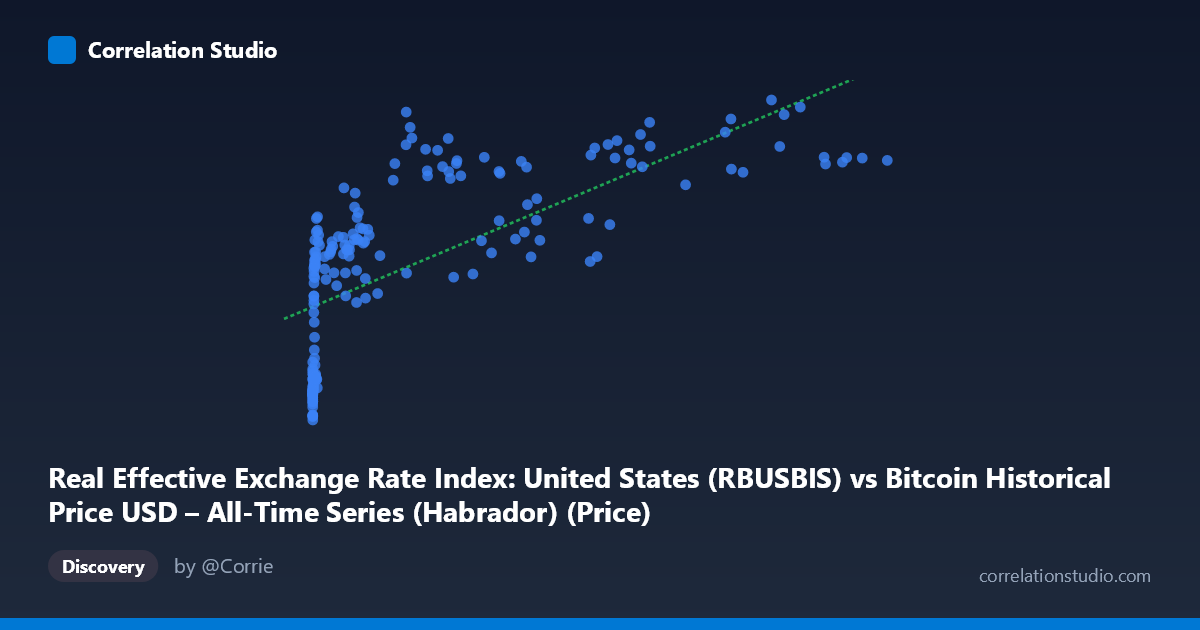
Real Effective Exchange Rate Index: United States (RBUSBIS) vs Bitcoin Historical Price USD – All-Time Series (Habrador) (Price)
- Pearson correlation (r)
- 0.684
- Spearman correlation
- 0.8714
- p-value
- 0
- Sample size (n)
- 189
- 95% confidence interval
- 0.5999 to 0.7532
- Granger causality
- None
- Granger optimal lag
- 1
- Time coverage
- 2010-08-01 to 2026-04-01
- Recomputed on refreshed data
- 2026-10-16 (r was 0.684)
AI analysis
Analysis: Bitcoin Price vs. US Real Effective Exchange Rate (REER) Index
1. What the Visualization Reveals
The scatterplot shows a positive but distinctly non-linear relationship between Bitcoin's USD price (X-axis, spanning an enormous range from $0.06 to $118,670) and the US REER index (Y-axis, ranging narrowly from ~78 to ~114). The data reveals a pattern more consistent with a logarithmic or power-law curve than a straight line: at very low Bitcoin prices (under $20), the REER index clusters tightly around 78–84, while as Bitcoin prices climb into the thousands and beyond, REER values rise and spread into the 95–115 range. The compression of X-values near zero combined with extreme right-skew (mean $20,533 vs. median likely far lower) is characteristic of an exponential growth series being compared against a bounded, mean-reverting macro index.
2. Strength, Direction, and Statistical Uncertainty
The Pearson correlation (r = 0.684, r² = 0.468) indicates a moderate-to-strong positive linear association, but this only explains 46.8% of the variance in REER — meaning more than half of the movement in the exchange rate index is unexplained by Bitcoin's price in a linear framework. The 95% CI [0.600, 0.753] is reasonably tight and excludes zero, and the p-value (~0) confirms this correlation is statistically robust across the 189 paired observations — this is not a chance finding. However, statistical significance of correlation says nothing about causal mechanism. The Granger causality tests are decisive here: neither direction shows significant predictive power (X→Y: p=0.662; Y→X: p=0.207), meaning past values of one series do not meaningfully improve forecasts of the other. This strongly suggests the correlation is driven by both series independently trending upward over the 2010–2026 window (a classic "spurious correlation via shared time trend") rather than any genuine lead-lag economic relationship.
3. Notable Patterns and Outliers
The most striking non-linear feature is the early cluster of points (X < 20, Y between 78–84) representing Bitcoin's infancy (2010–2011), where REER was near cycle lows — these points anchor the low end and heavily influence the log-like curve shape. Above roughly X = 1,000, the relationship flattens and becomes noisy: REER values bounce between 95 and 115 regardless of whether Bitcoin is at $6,000 or $118,000, suggesting a saturation effect or that REER is simply oscillating within its historical macro range independent of Bitcoin's later price action. Notable outliers include points like (58724.66, 96.84) and (45092.81, 96.81), where high BTC prices correspond to relatively low REER, breaking the general upward trend — likely reflecting different macro periods (e.g., dollar weakness during a BTC bull run) mixed together on the same chart.
4. Confounding Factors and Caveats
This is a textbook case of time-trend confounding: both Bitcoin price and the REER index have their own long-term trajectories over 2010–2026 (BTC growing exponentially due to adoption/speculation; REER driven by Fed policy, trade balances, and global risk sentiment), and any two upward-trending time series will show spurious positive correlation without genuine linkage. The lack of Granger causality in either direction reinforces that this is likely not a causal economic relationship but a coincidental co-trending of unrelated processes. Additionally, comparing a monthly macro index to Bitcoin price (which may be sampled at different frequency/granularity) risks alignment/aggregation artifacts, and the extreme heteroscedasticity (variance in Y is much smaller than variance in X in relative terms) violates standard linear regression assumptions, inflating apparent fit while masking poor predictive utility in either tail.
5. Recommendations for Further Investigation
Given the note that Spearman ρ likely exceeds Pearson r, a log-transform of Bitcoin price (log(X) vs. Y) should be tested — this would linearize the relationship and likely produce a cleaner, more interpretable fit and higher R². Beyond re-specifying the functional form, analysts should detrend both series (e.g., using first differences or residuals from separate time trends) and re-run correlation/Granger tests on the detrended data to check whether any genuine short-term co-movement exists once the shared upward drift is removed. Given the absence of Granger causality, this relationship should not be used for predictive or trading purposes; instead, treat REER as one of many macro variables and investigate more theoretically grounded drivers of Bitcoin price (e.g., liquidity conditions, real interest rates, or risk-asset flows) rather than the REER index directly.
X dataset: Bitcoin Historical Price USD – All-Time Series (Habrador)
Y dataset: Real Effective Exchange Rate Index: United States
Part of experiment: Bitcoin - Bitcoin Historical Price USD – All-Time Series (Habrador) vs Real Effective Exchange Rate Index: United States