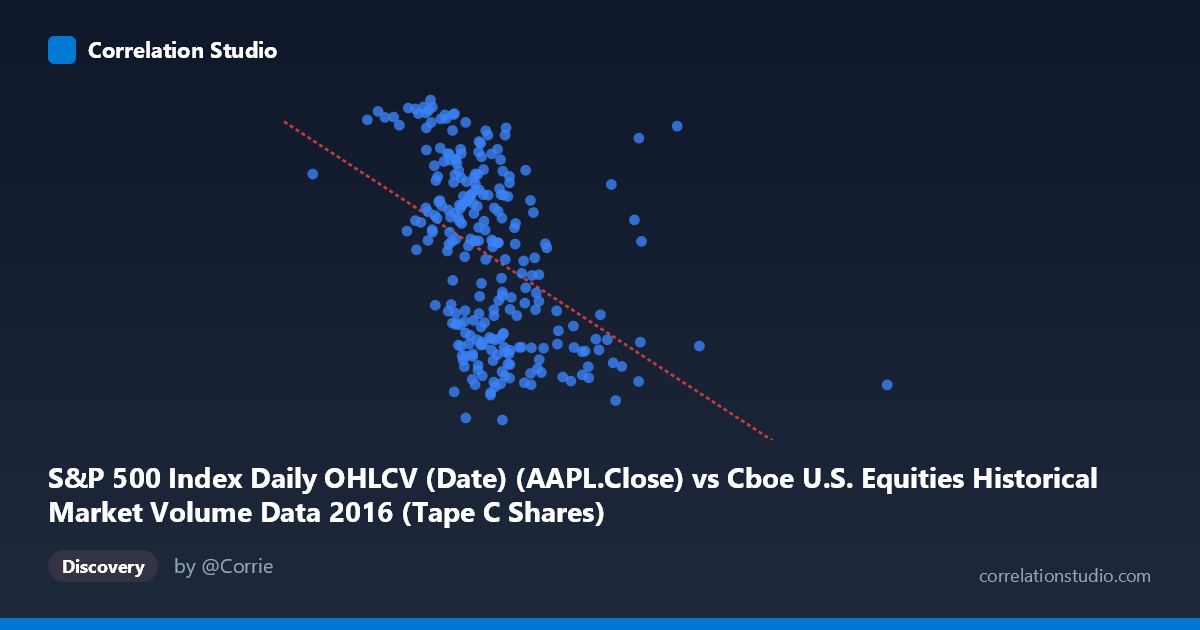
S&P 500 Index Daily OHLCV (Date) (AAPL.Close) vs Cboe U.S. Equities Historical Market Volume Data 2016 (Tape C Shares)
- Pearson correlation (r)
- -0.4416
- Spearman correlation
- -0.5056
- p-value
- 0
- Sample size (n)
- 252
- 95% confidence interval
- -0.536 to -0.3364
- Granger causality
- None
- Granger optimal lag
- 1
AI analysis
Scatterplot Analysis: AAPL Close Price vs. Cboe Tape C Share Volume (2016)
Relationship Overview
The scatterplot reveals a moderate negative relationship between Apple's closing price (X-axis) and Cboe Tape C share volume (Y-axis) across 252 trading days in 2016. As AAPL's closing price increases, Cboe Tape C volume tends to decline, suggesting that periods of higher AAPL valuations coincide with reduced trading activity on Tape C venues. The linear regression equation (y = -1.239×10⁻⁷x + 121.077) confirms this inverse slope, though the scatter around the regression line is visibly wide, indicating the relationship is real but imprecise. The data cluster primarily within the $105–$165M AAPL price range against 90–118 volume units, with the bulk of observations concentrated in a somewhat elliptical cloud tilted from upper-left to lower-right.
Correlation Strength and Statistical Significance
The Pearson correlation of r = -0.4416 indicates a moderate negative association, but the explanatory power is modest: R² = 0.195, meaning only about 19.5% of the variance in Tape C volume is explained by AAPL's closing price. The remaining ~80.5% is attributable to other factors entirely outside this bivariate model. The 95% confidence interval of [-0.536, -0.336] is meaningfully narrow and does not cross zero, reinforcing that the negative direction is reliable. The p-value of 1.87×10⁻¹³ confirms the correlation is highly statistically significant — virtually impossible to attribute to chance given n=252. However, statistical significance here is partly a function of sample size; the practical magnitude remains modest. Critically, the Granger causality tests find no significant predictive directionality in either direction (X→Y: F=1.013, p=0.315; Y→X: F=0.643, p=0.423), meaning neither variable reliably predicts future values of the other with a one-period lag. This strongly cautions against any causal interpretation.
Notable Patterns, Clusters, and Outliers
Several structural features are visible in the data. The main mass of observations forms a loose downward-sloping band, but with considerable vertical dispersion — at any given AAPL price level, Tape C volume spans nearly 20–25 units, reflecting substantial day-to-day variability. A handful of potential outliers are apparent: points with relatively low AAPL prices (~$95–$105M range) yet extreme Tape C volume readings near 117–118 stand out above the main cloud, and conversely, some observations in the $130–$170M price range show unusually low volume near 90–92. The point cluster around $120–$130M AAPL price is notably dense, reflecting that AAPL traded in this range for extended stretches of 2016. There is no strong visual evidence of non-linearity, though the wide vertical scatter hints that a simple linear model may be leaving meaningful structure uncaptured.
Confounding Factors and Interpretive Caveats
Several important caveats apply. First, this analysis conflates two fundamentally different measurement scales — AAPL share price and a broad market venue volume metric — making direct causal attribution implausible. Both variables are likely jointly driven by macroeconomic regimes, risk-on/risk-off sentiment cycles, or specific 2016 market events (e.g., Brexit, U.S. election volatility) that simultaneously affect both. Second, the axes appear swapped from their natural roles (AAPL Close is labeled as coming from the Cboe dataset, and Tape C volume from the S&P 500 dataset), suggesting a possible data-joining artifact that warrants verification. Third, the negative correlation may reflect a liquidity-price tradeoff: when AAPL (and the broader market) rallies, trading volume on specific venues may compress as fewer investors feel urgency to transact. Finally, autocorrelation within daily time series data means the effective degrees of freedom may be lower than n=252 implies, potentially inflating apparent significance.
Actionable Insights and Further Investigation
Given the modest explanatory power and absence of Granger causality, practitioners should avoid using AAPL price alone as a predictive signal for Tape C volume. Instead, it would be valuable to: (1) incorporate additional explanatory variables such as VIX (volatility index), total market volume, or macroeconomic event indicators to build a more complete volume model; (2) test for regime-dependent behavior by segmenting 2016 into pre- and post-election periods, where market dynamics shifted considerably; (3) explore lagged cross-correlations beyond lag-1 to rule out longer-horizon predictive relationships that the single-lag Granger test may miss; and (4) verify the dataset join logic to ensure the X and Y series are correctly aligned by date before drawing any further conclusions. A multivariate or time-series decomposition approach would substantially improve both explanatory and predictive value over this bivariate framework.
X dataset: Cboe U.S. Equities Historical Market Volume Data 2016
Y dataset: S&P 500 Index Daily OHLCV (Date)
Part of experiment: Daily - Cboe U.S. Equities Historical Market Volume Data 2016 vs S&P 500 Index Daily OHLCV (Date)