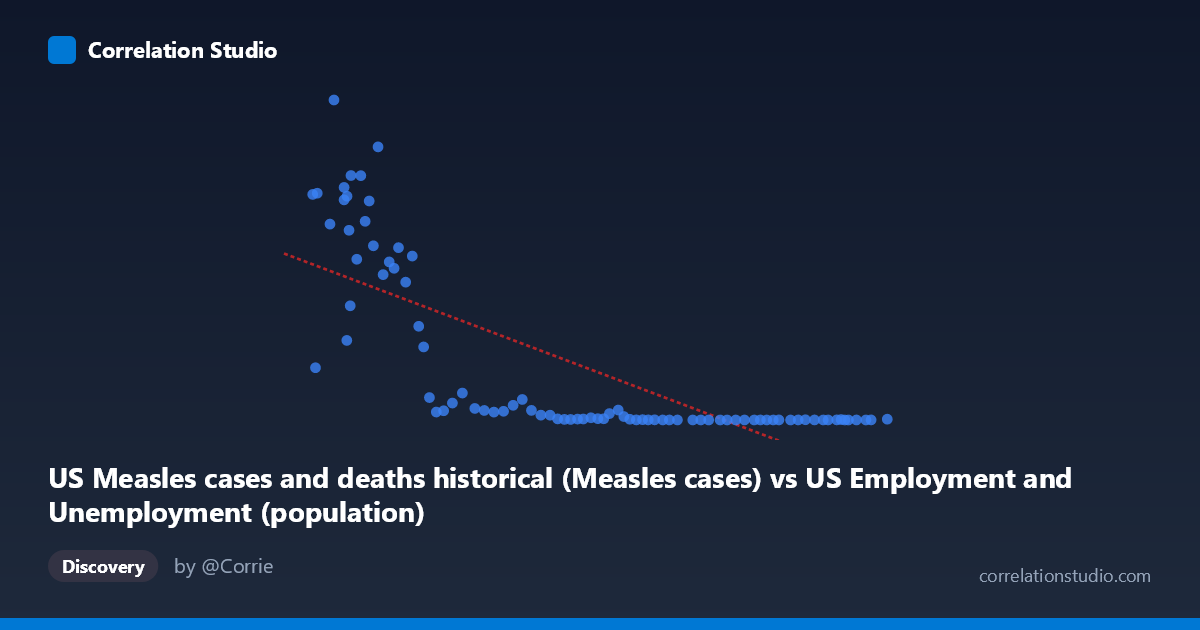
US Measles cases and deaths historical (Measles cases) vs US Employment and Unemployment (population)
- Pearson correlation (r)
- -0.7533
- Spearman correlation
- -0.9129
- p-value
- 0
- Sample size (n)
- 85
- 95% confidence interval
- -0.8328 to -0.6435
- Granger causality
- None
- Granger optimal lag
- 10
AI analysis
Scatterplot Analysis: US Measles Cases vs. US Population (1941–2025)
1. What the Visualization Reveals
The scatterplot displays a strong negative relationship between annual US measles cases (X-axis) and US population (Y-axis) over eight decades. The data forms a distinctive L-shaped or hyperbolic curve rather than a clean linear spread, with high-measles years clustered in the lower-left quadrant showing extremely large case counts (up to ~894,000) paired with relatively smaller population figures (pre-1960s), while the modern era shows near-zero measles cases alongside very large population values. This temporal structure — where both variables move monotonically over time — is the fundamental story the chart is telling: as the US population grew steadily, measles cases collapsed dramatically following vaccine introduction in 1963.
2. Correlation Strength, Direction, and Causality
The Pearson r of -0.7533 indicates a strong negative correlation, and the R² of 0.5675 means that approximately 56.7% of the variance in population is statistically explained by measles case counts in this paired dataset — a substantial figure for public health time-series data. The 95% confidence interval of [-0.8328, -0.6435] is notably tight and entirely negative, confirming the directional relationship with high confidence, and the p-value of effectively 0 leaves no ambiguity about statistical significance at any conventional threshold. However, Granger causality testing found no significant predictive direction in either direction (X→Y: F=1.54, p=0.150; Y→X: F=1.55, p=0.148), meaning neither variable temporally predicts the other after controlling for their own past values. This is a critical finding: the correlation is real but neither measles cases drive population changes nor does population drive measles elimination in a temporally leading sense — both are being driven by a third temporal force, namely vaccination policy and public health infrastructure.
3. Notable Patterns, Clusters, and Non-Linearity
The data exhibits pronounced non-linearity, which is directly flagged by the Spearman ρ exceeding Pearson r — a logarithmic or power-law model would substantially outperform the linear regression (y = -3.37x + 748,553) shown. Visually, the distribution separates into two distinct clusters: a high-dispersion group with measles cases above ~100,000 (pre-vaccine era, lower population) and a tightly compressed group near the X-axis origin with cases below ~5,000 (post-vaccine era, higher population). Several outliers stand out dramatically — the point at approximately (99,900; 894,134) represents an extreme measles year with the highest case count in the sample, and points like (113,727; 763,094) and (108,321; 682,720) reflect severe epidemic years. Conversely, the cluster of points with X values above 200,000 and Y values near zero represents the modern elimination era, where measles is essentially eradicated domestically.
4. Confounding Factors and Interpretive Caveats
The most significant caveat is that this correlation is almost entirely mediated by time. Both variables are monotonic functions of calendar year in opposite directions — population grows continuously, measles cases decline sharply after 1963 — making the observed correlation largely a spurious artifact of shared temporal trend rather than any direct mechanistic link. The dataset description itself contains a metadata inconsistency: the X-axis is labeled as measles cases but sourced from a US Employment dataset, and the Y-axis is labeled population but sourced from the measles dataset, suggesting possible column misattribution that should be verified before drawing conclusions. Additionally, the mixed provenance of these datasets (employment/unemployment vs. measles surveillance) raises questions about alignment of annual reporting periods and whether population figures represent mid-year estimates or end-of-year census values. The non-linear structure also means that linear R² substantially understates the true association in the epidemic-era portion of the data while overstating it in the near-zero modern era.
5. Actionable Insights and Further Investigation
Given the clearly non-linear relationship, fitting a logarithmic or exponential decay model to measles cases as a function of time, and separately modeling population growth, would yield more interpretively honest regression parameters. Researchers should explicitly introduce year or vaccine-era as a covariate to test whether any residual correlation between measles and population exists after detrending — almost certainly it would not. A breakpoint or segmented regression around 1963 (measles vaccine licensure) would likely reveal that the pre- and post-vaccine periods have fundamentally different data-generating processes. Investigating why certain high-population, low-measles years still show elevated case counts (the handful of outliers in the upper-right region) could illuminate importation events or vaccination coverage gaps. Finally, the Granger causality null result should prompt analysts to abandon any causal framing for this correlation entirely and treat it purely as a historical documentation of parallel public health trends rather than evidence of any predictive or mechanistic relationship.
X dataset: US Employment and Unemployment
Y dataset: US Measles cases and deaths historical
Part of experiment: Yearly - US Employment and Unemployment vs US Measles cases and deaths historical