VIX Daily Index (OPEN) vs Cboe U.S. Equities Historical Market Volume Data 2011 (Tape C Trade Count)
- Pearson correlation (r)
- 0.4416
- Spearman correlation
- 0.4186
- p-value
- 0
- Sample size (n)
- 252
- 95% confidence interval
- 0.3363 to 0.5359
- Granger causality
- None
- Granger optimal lag
- 1
AI analysis
Scatterplot Analysis: VIX Open vs. Tape C Trade Count (2011)
Relationship Overview
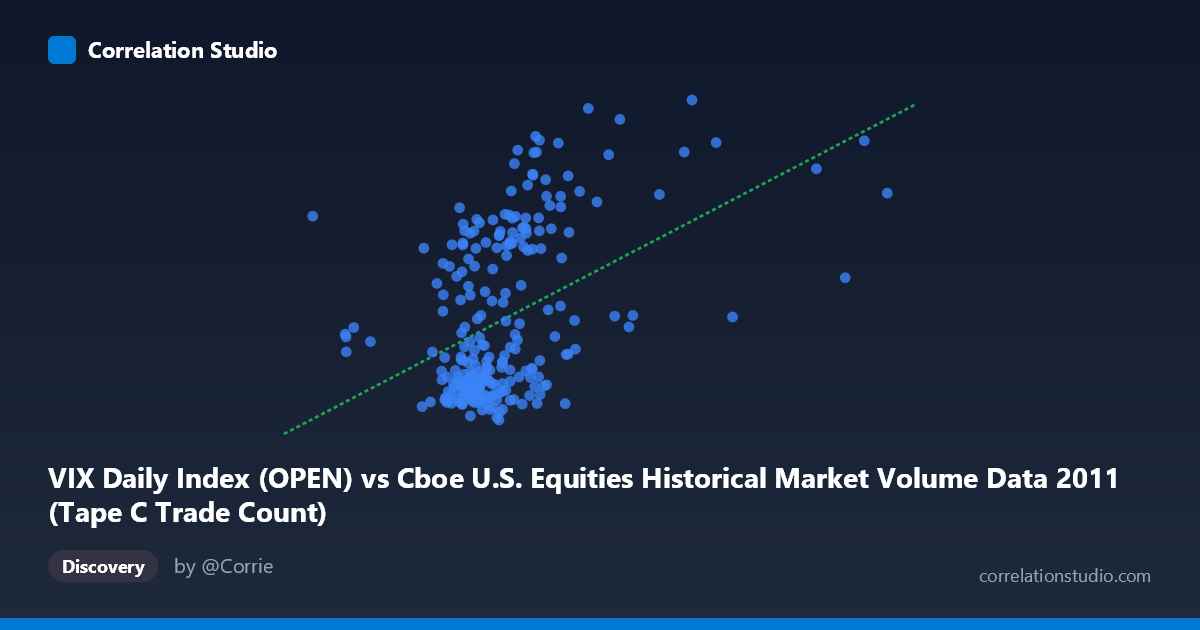
The scatterplot reveals a moderate positive relationship between the Cboe VIX Daily Index (Open) and the Tape C Trade Count across U.S. equities exchanges in 2011. As market volatility (VIX) rises, trade counts on Tape C tend to increase, which aligns intuitively with the well-established market dynamic that elevated uncertainty drives higher trading activity. The linear regression equation (y = 2.976E-05x + 7.970) confirms this upward slope, though the scatter around the regression line is considerable, indicating that VIX open values alone provide an incomplete picture of trade volume behavior.
Correlation Strength and Statistical Framing
The Pearson correlation of r = 0.4416 reflects a moderate positive association, but the coefficient of determination (r² = 0.1950) is the more sobering figure — it indicates that only ~19.5% of the variance in Tape C Trade Count is explained by VIX Open values, leaving roughly 80% attributable to other factors. The 95% confidence interval [0.3363, 0.5359] is entirely positive and relatively narrow given the sample size (n = 252, N = 3,780), and the p-value of 1.894E-13 confirms the relationship is highly statistically significant — this is not a chance finding. However, statistical significance here is partly a function of the large population size and should not be conflated with practical importance. Crucially, the Granger causality tests show no significant temporal predictive direction in either direction (X→Y: F = 0.4675, p = 0.4948; Y→X: F = 0.0671, p = 0.7958), meaning that knowing yesterday's VIX does not meaningfully help predict today's trade count, and vice versa. The relationship appears contemporaneous rather than predictive, which substantially limits its utility for forecasting.
Notable Patterns, Clusters, and Outliers
The sample points reveal a bimodal or clustered structure in the data. A dense concentration of observations appears at lower VIX values (roughly X: 400,000–600,000; Y: 15–25), while a secondary cluster exists at higher trade counts (Y: 30–45) spread across a broader VIX range. Several notable outliers are visible — for example, the point near (921,203, 41.94) sits in isolation at a very high VIX value with an elevated trade count, likely corresponding to a specific high-volatility market event in 2011 (e.g., the August debt ceiling crisis or European sovereign debt turbulence). Points like (274,733, 22.58) and (317,399, 22.12) appear on the far left, suggesting lower-volatility periods with moderate trade activity. The relationship does not appear strictly linear across the full range, hinting at possible threshold effects where trade count escalates more sharply above certain VIX levels.
Confounding Factors and Caveats
Several important caveats apply. First, 2011 was an unusually volatile year marked by the U.S. debt ceiling standoff, S&P's U.S. credit downgrade, and ongoing European sovereign debt fears — meaning results may not generalize to other market regimes. Second, Tape C specifically covers NYSE Arca-listed securities (predominantly ETFs), and ETF trading volume is known to surge independently during volatility events, which could artificially inflate the correlation. Third, algorithmic and high-frequency trading behaviors, market microstructure changes, and calendar effects (e.g., options expiration weeks, quarter-ends) could independently drive both variables upward simultaneously — creating spurious co-movement without true causal linkage. The axis labels also appear swapped in dataset attribution (VIX data appears on the X-axis from the market volume dataset and vice versa), which warrants verification of the underlying data pipeline.
Actionable Insights and Further Investigation
Despite the modest explanatory power, this relationship has practical implications for exchange operations, liquidity planning, and risk management. Market makers and exchanges could use VIX open levels as a rough signal for anticipated Tape C activity, though the ~80% unexplained variance demands supplementary predictors. Further investigation should include: (1) non-linear modeling (e.g., polynomial regression or spline fits) to capture potential threshold behavior; (2) multivariate regression incorporating additional predictors such as S&P 500 returns, options expiration calendars, and other tape volumes; (3) regime analysis separating calm vs. crisis periods to test whether the correlation strengthens materially during high-volatility episodes; and (4) extending the time series beyond 2011 to assess whether this relationship is stable across different market environments, particularly post-2015 when market structure and VIX dynamics shifted considerably.
X dataset: Cboe U.S. Equities Historical Market Volume Data 2011
Y dataset: VIX Daily Index
Part of experiment: Daily - Cboe U.S. Equities Historical Market Volume Data 2011 vs VIX Daily Index