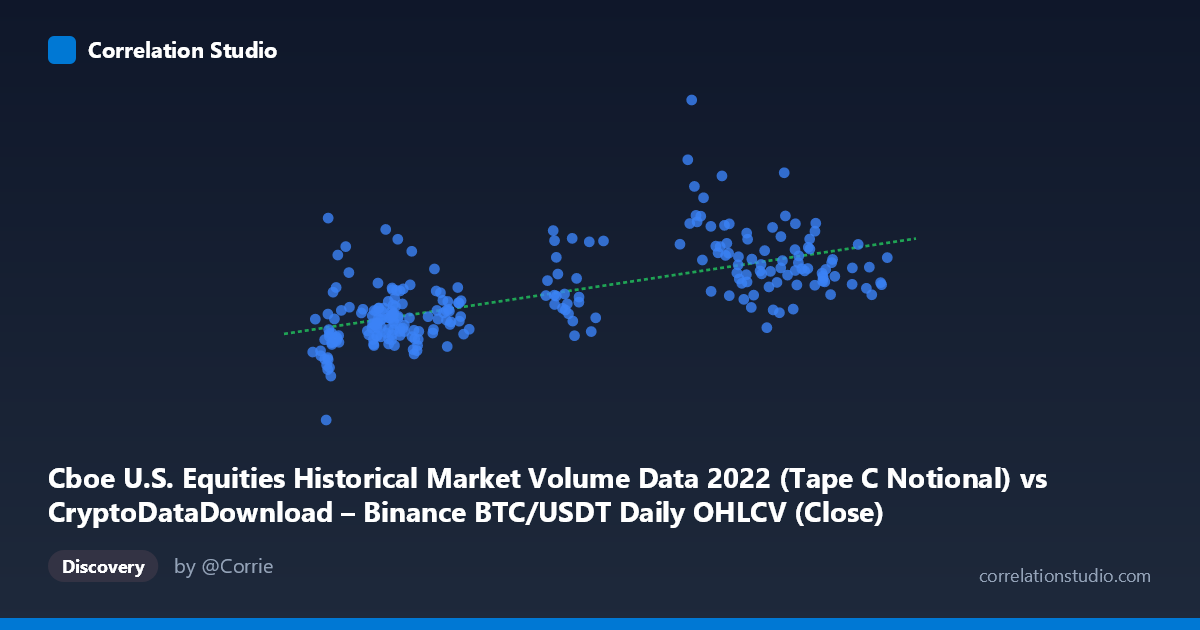
Cboe U.S. Equities Historical Market Volume Data 2022 (Tape C Notional) vs CryptoDataDownload – Binance BTC/USDT Daily OHLCV (Close)
- Pearson correlation (r)
- 0.6544
- Spearman correlation
- 0.6847
- p-value
- 0
- Sample size (n)
- 251
- 95% confidence interval
- 0.5774 to 0.7199
- Granger causality
- None
- Granger optimal lag
- 10
AI analysis
Analysis: Cboe Equities Volume vs. Binance BTC/USDT Close Price (2022)
1. What the Visualization Reveals
The scatterplot shows a moderate positive relationship between U.S. equities market notional volume (X-axis, mislabeled in the data as "Tape C Notional" but paired with BTC/USDT close prices on Y) and Bitcoin's closing price. As equity trading volume increases, Bitcoin's price tends to rise as well, though the relationship is far from tight — points are noticeably scattered around the fitted regression line (y = 191,399x + 7.21B), indicating substantial unexplained variance at any given X value.
2. Strength, Direction, and Uncertainty
The correlation coefficient (r = 0.6544) indicates a moderate-to-strong positive linear relationship, but r² = 0.4283 tells the more important story: only 42.8% of the variance in Bitcoin's price is explained by equity volume, leaving the majority (57%) driven by other factors. The 95% CI [0.577, 0.720] is reasonably tight given n=251, and the p-value of ~0 confirms this correlation is highly unlikely to be due to chance — the relationship is statistically robust even if not deterministic. However, the Granger causality tests are critical here: neither direction shows significant predictive power (X→Y: p=0.551; Y→X: p=0.368). This means despite the strong contemporaneous correlation, equity volume does not temporally predict Bitcoin price movements, or vice versa. The correlation is likely driven by both series responding to a common underlying macro factor (e.g., market-wide risk sentiment, liquidity conditions, or volatility regimes in 2022) rather than one causing the other.
3. Notable Patterns and Outliers
Several features stand out in the sample data: - Clustering by X-value bands: Low-X points (X ≈ 16,000–23,000) show relatively depressed, tightly-clustered Y-values (~9-13B), while high-X points (X ≈ 36,000-45,000) show much greater spread (13B to 22B+), suggesting heteroscedasticity — variance in Y increases with X. - Notable outliers: Points like (36445, 22.09B) and (41757, 21.19B) sit well above the trend line, while (20469, 16.54B) and (21238, 15.70B) are unusually high for their low X-values — suggesting episodic decoupling, possibly tied to specific 2022 crypto-market events (e.g., Terra/LUNA collapse in May, FTX collapse in November) that spiked BTC volatility independent of equity volume. - The relationship appears non-linear or regime-dependent rather than strictly linear — consistent with 2022 being a year of crypto-specific shocks layered on top of general macro conditions.
4. Confounding Factors and Caveats
Several caveats limit causal interpretation: - Spurious/common-cause correlation: 2022 was marked by synchronized macro tightening (Fed rate hikes), which suppressed both equity trading activity and crypto valuations simultaneously — a classic confound where a third variable (interest rate policy, risk-off sentiment, VIX) drives both series. - Non-stationarity: Both time series likely trended over 2022 (BTC price declined significantly, equity volumes fluctuated), and correlating two trending/non-stationary series without differencing can inflate apparent correlation artificially. - Data granularity mismatch: Population N=3,212 vs. sampled n=251 suggests substantial subsampling — care should be taken that the sample is representative and not systematically biased toward certain volatility regimes. - Lag structure: The optimal Granger lag of 10 periods was tested, but true causal relationships (if any) might operate at different frequencies (e.g., intraday) not captured in daily aggregates.
5. Actionable Insights & Further Investigation
- Avoid using equity volume as a direct trading signal for BTC price — the lack of Granger causality means this correlation has no demonstrated predictive/forecasting value. - Test with differenced/detrended series (returns instead of levels) to rule out spurious correlation from shared trends, and re-run Granger causality on stationary transformations. - Investigate common macro drivers directly — incorporate VIX, DXY (dollar index), or Fed funds rate as candidate confounders/mediators to see if they better explain the shared variance. - Segment analysis by event windows (e.g., pre/post-LUNA collapse, pre/post-FTX collapse) to check if the correlation strength is regime-dependent rather than stable throughout 2022. - Explore volatility clustering: given the heteroscedasticity pattern, a model accounting for time-varying variance (e.g., GARCH) may reveal a more nuanced relationship than a simple linear fit.
X dataset: CryptoDataDownload – Binance BTC/USDT Daily OHLCV
Y dataset: Cboe U.S. Equities Historical Market Volume Data 2022
Part of experiment: Bitcoin - CryptoDataDownload – Binance BTC/USDT Daily OHLCV vs Cboe U.S. Equities Historical Market Volume Data 2022