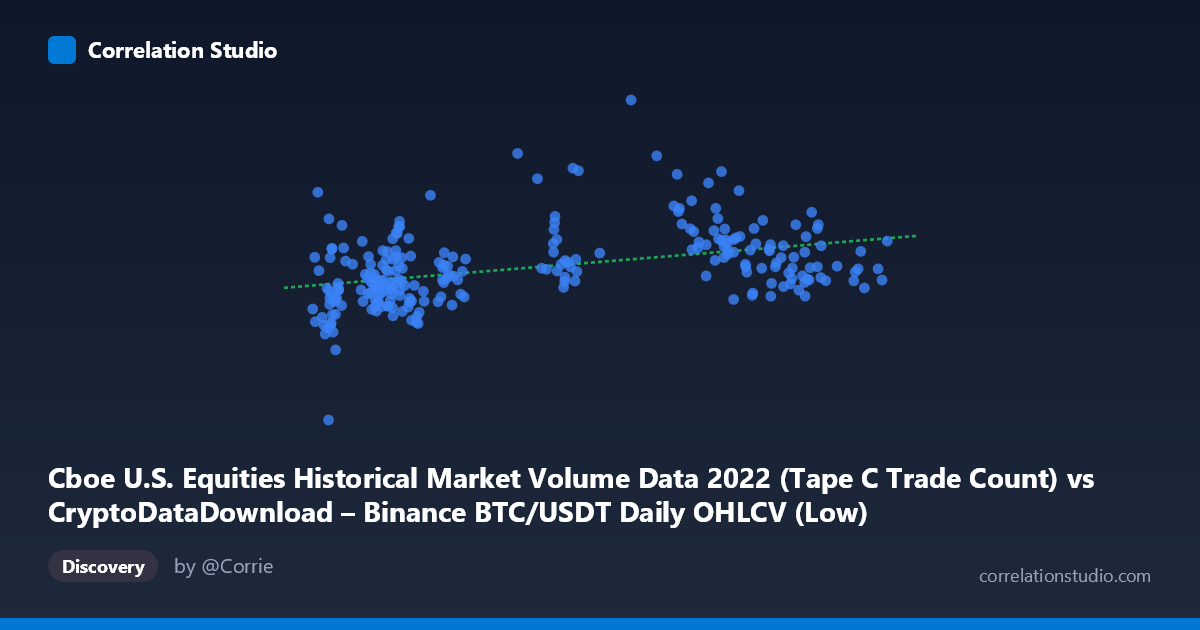
Cboe U.S. Equities Historical Market Volume Data 2022 (Tape C Trade Count) vs CryptoDataDownload – Binance BTC/USDT Daily OHLCV (Low)
- Pearson correlation (r)
- 0.4016
- Spearman correlation
- 0.4436
- p-value
- 0
- Sample size (n)
- 251
- 95% confidence interval
- 0.2923 to 0.5006
- Granger causality
- None
- Granger optimal lag
- 10
- Time coverage
- 2022-01-03 to 2022-12-30
AI analysis
Analysis: Cboe Equities Trade Count vs. BTC/USDT Daily Low
1. What the Visualization Reveals
The scatterplot shows a weak-to-moderate positive relationship between Cboe U.S. equities Tape C trade count and the daily low price of BTC/USDT. Points are widely scattered around the regression line (y = 10.58x + 1,443,180), with no tight linear clustering. Visually, the cloud of points fans out considerably, especially at lower X-values (15,000–25,000 trade count range), where Y ranges from roughly 1.35M to 2.5M — nearly the full span of the dataset. This dispersion signals that X alone is a poor predictor of Y on any given day.
2. Strength, Direction, and Statistical Confidence
The correlation coefficient (r = 0.402) indicates a modest positive association, and r² = 0.161 means only about 16% of the variance in BTC's daily low is statistically explained by equity trade counts — leaving 84% attributable to other factors. The 95% CI [0.292, 0.501] is reasonably tight and excludes zero, and the p-value (3.8E-11) confirms this correlation is highly unlikely to be due to chance in this sample. However, statistical significance here reflects the sample size, not practical strength — an r² of 0.16 is generally considered a weak-to-modest effect in practical terms. Critically, the Granger causality tests show no significant predictive direction in either direction (X→Y: p=0.705; Y→X: p=0.125). This means neither variable's past values help forecast the other's future values — the relationship, whatever its source, is not one of temporal lead-lag causality, at least at the tested lag structure.
3. Notable Patterns and Outliers
Several points stand out: values like (26700, 2,539,165), (27785, 2,360,551), and (37867, 2,411,035) show unusually high Y relative to their X, suggesting episodic spikes in BTC's low price uncorrelated with equity trade volume — possibly crypto-specific rallies. Conversely, low-Y points paired with mid-range X (e.g., 40610 → 1,621,602) suggest periods where equities trading was active but BTC prices were subdued. There's no clear evidence of nonlinearity (e.g., no visible curve, threshold, or saturation effect) — the scatter looks like a noisy linear trend with substantial unexplained variance, rather than a structured nonlinear pattern.
4. Confounding Factors and Caveats
This pairing is unusual: it correlates an equities market microstructure metric (Tape C trade count, essentially a proxy for U.S. market activity/volatility) with a crypto asset price level (BTC daily low), not a return or volume metric. Both series likely share a common confounder — 2022 was a period of synchronized macro stress (Fed rate hikes, risk-off sentiment) affecting both equities activity and crypto valuations simultaneously. This shared macro regime could produce correlation without any direct causal link between Cboe trade counts and BTC prices. Additionally, comparing a price level (Y) rather than returns introduces trend/non-stationarity issues — BTC's price decline through 2022 and any trend in equity trade counts could mechanically inflate correlation (spurious trend correlation) even absent a real relationship.
5. Suggestions for Further Investigation
Given the non-stationarity concern, analysts should re-run this analysis using returns or first differences rather than levels, which is standard practice for financial time series and would better isolate genuine co-movement from shared trends. Since Granger causality found no lead-lag structure, any perceived "relationship" is more likely contemporaneous and macro-driven rather than one market informing the other — worth testing against a common third variable (e.g., VIX, DXY, or Fed policy dates) to see if it fully explains the correlation. Given r² of only 16%, this pairing should not be used for predictive trading models without substantial additional features; if the goal is understanding BTC price drivers, exploring crypto-specific volume/liquidity metrics or on-chain data would likely yield more explanatory power than U.S. equities trade counts.
X dataset: CryptoDataDownload – Binance BTC/USDT Daily OHLCV
Y dataset: Cboe U.S. Equities Historical Market Volume Data 2022
Part of experiment: Bitcoin - CryptoDataDownload – Binance BTC/USDT Daily OHLCV vs Cboe U.S. Equities Historical Market Volume Data 2022