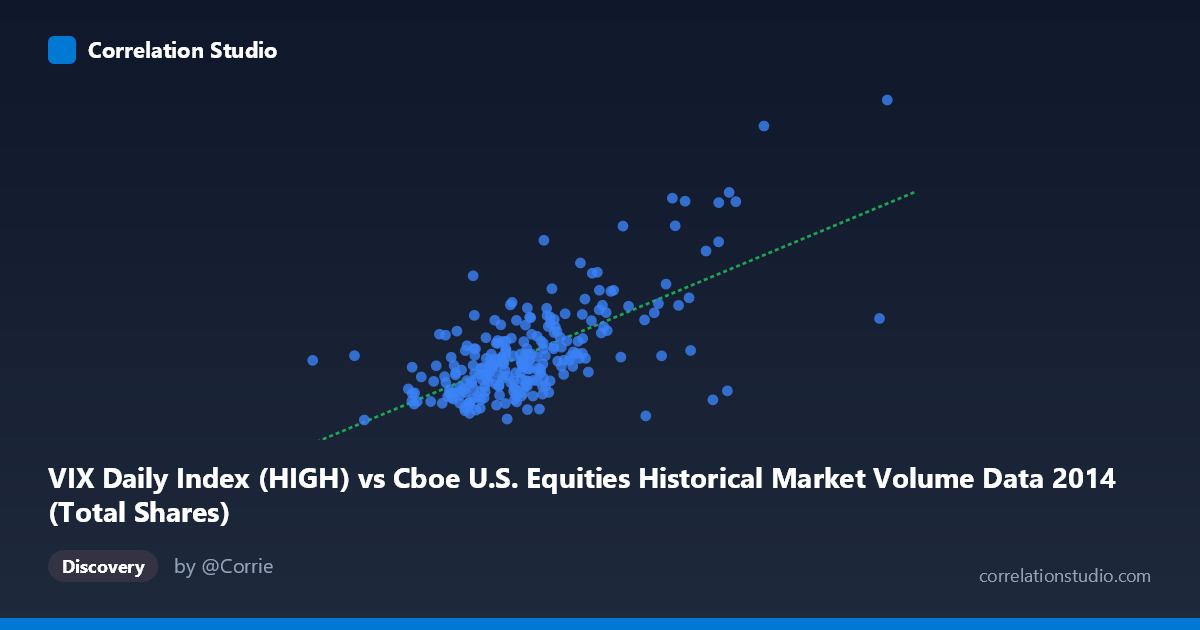
VIX Daily Index (HIGH) vs Cboe U.S. Equities Historical Market Volume Data 2014 (Total Shares)
- Pearson correlation (r)
- 0.6723
- Spearman correlation
- 0.582
- p-value
- 0
- Sample size (n)
- 252
- 95% confidence interval
- 0.5984 to 0.7348
- Granger causality
- None
- Granger optimal lag
- 1
AI analysis
Analysis: VIX Daily Index (HIGH) vs. Total Shares Traded (2014)
Relationship Overview The scatterplot reveals a positive relationship between the CBOE VIX Daily Index High values and total shares traded on U.S. equities exchanges throughout 2014. As the VIX high increases, total share volume tends to rise as well, which aligns intuitively with market dynamics: elevated volatility typically drives higher trading activity as investors rebalance, hedge, or react to uncertainty. The linear regression equation (y = 2.314E-08x + 4.786) confirms this upward trend, though the scatter around the regression line suggests the relationship is meaningful but far from deterministic.
Correlation Strength and Statistical Significance The correlation coefficient of r = 0.6723 indicates a moderate-to-strong positive association. However, the r² of 0.4519 is the more revealing statistic — it tells us that approximately 45.2% of the variance in total shares traded is explained by the VIX high, leaving roughly 55% attributable to other factors. The 95% confidence interval for r of [0.5984, 0.7348] is reasonably tight, suggesting reliable estimation of the true population correlation, and the p-value of effectively zero confirms this result is highly statistically significant across the full population of N = 3,686 observations. Critically, however, Granger causality tests find no significant predictive directionality in either direction (X→Y: F = 0.8226, p = 0.365; Y→X: F = 0.2302, p = 0.632). This means that while the two variables are correlated contemporaneously, neither reliably predicts the other with a one-period lag — ruling out a simple lead-lag trading signal.
Notable Patterns, Clusters, and Outliers The sample points reveal a dense cluster concentrated in the lower-left region, roughly where VIX highs fall between 350M–500M and total shares range from 11–17. This suggests that most trading days in 2014 were characterized by relatively low volatility and moderate volume — consistent with a generally calm equity market for much of the year. However, there are clear high-leverage outliers in the upper-right region, most notably points near (710M, 29.4) and (670M, 25.2), which likely correspond to specific volatility spikes in late 2014 (e.g., the October 2014 market correction tied to Ebola fears and oil price declines). These outliers appear to exert substantial influence on the regression slope and may be inflating the correlation coefficient. There also appears to be modest non-linearity — the relationship may accelerate at higher VIX levels, suggesting a threshold or regime-change effect rather than a purely linear dynamic.
Confounding Factors and Caveats Several important caveats apply. First, causality cannot be inferred: the Granger test explicitly shows neither variable temporally predicts the other, meaning the correlation likely reflects a common response to underlying market events (e.g., macro shocks simultaneously driving both volatility and volume) rather than a direct mechanism. Second, the axis labels appear swapped relative to their source datasets — the X-axis is labeled as VIX High from the "Market Volume" dataset, and the Y-axis is labeled as "Total Shares" from the "VIX Daily Index" dataset, which may indicate a data joining artifact that warrants verification. Third, 2014 represents a single calendar year with idiosyncratic events, limiting generalizability. Fourth, influential outliers from the October 2014 spike may be disproportionately driving the r value, and a robust regression or outlier-exclusion sensitivity test would be advisable.
Actionable Insights and Further Investigation Practitioners should not treat VIX levels as a predictive signal for volume (or vice versa) given the failed Granger causality tests — any apparent predictability is likely spurious at a one-day lag. However, the strong contemporaneous correlation does suggest that risk management and liquidity provisioning models should account for VIX levels when estimating expected daily volume. Further investigation should include: (1) testing non-linear or regime-switching models to better capture the accelerating relationship at high VIX levels; (2) extending the analysis across multiple years to assess whether the 0.67 correlation is stable or specific to 2014's market conditions; (3) introducing mediating variables such as S&P 500 returns, bid-ask spreads, or institutional flow data to decompose the unexplained 55% variance; and (4) verifying the dataset join integrity given the potentially swapped column-source labels noted above.
X dataset: Cboe U.S. Equities Historical Market Volume Data 2014
Y dataset: VIX Daily Index
Part of experiment: Daily - Cboe U.S. Equities Historical Market Volume Data 2014 vs VIX Daily Index