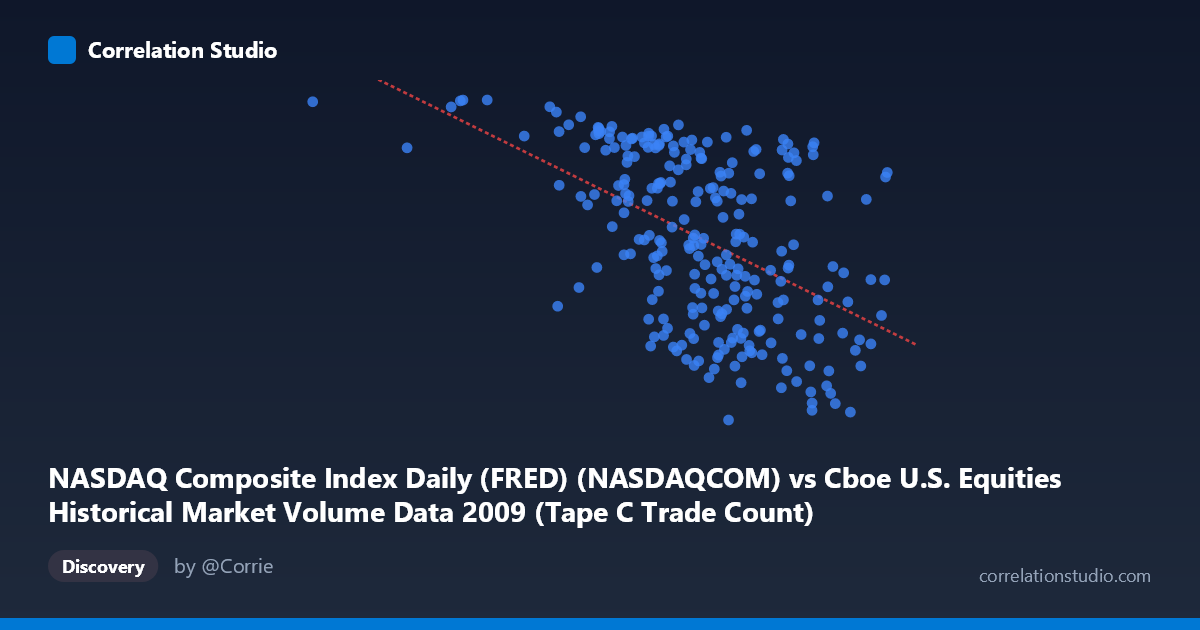
NASDAQ Composite Index Daily (FRED) (NASDAQCOM) vs Cboe U.S. Equities Historical Market Volume Data 2009 (Tape C Trade Count)
- Pearson correlation (r)
- -0.5054
- Spearman correlation
- -0.5153
- p-value
- 0
- Sample size (n)
- 252
- 95% confidence interval
- -0.592 to -0.4073
- Granger causality
- None
- Granger optimal lag
- 10
AI analysis
Analysis: NASDAQ Composite Index vs. Cboe Tape C Trade Count (2009)
Relationship Overview
The scatterplot reveals a moderate negative relationship between the NASDAQ Composite Index level and Cboe Tape C Trade Count during 2009. As the NASDAQ index rose throughout the year (recovering from the financial crisis lows), the number of trades recorded on Tape C (NASDAQ-listed securities routed through Cboe) tended to decline. This is counterintuitive at first glance — rising markets are often associated with increased activity — but reflects a specific dynamic of the 2009 recovery period where panic-driven, high-frequency trading volume gradually normalized as fear subsided and prices climbed. The linear regression equation (y = −0.00137x + 2,713.71) quantifies this inverse slope, with each 100,000-unit increase in the NASDAQ index associated with roughly a 137-unit decrease in trade count.
Correlation Strength and Statistical Framing
The Pearson correlation of r = −0.5054 indicates a moderate negative association. The R² of 0.2555 means that approximately 25.5% of the variance in Tape C trade counts is explained by the NASDAQ index level — meaningful, but leaving roughly three-quarters of variance attributable to other factors. The 95% confidence interval of [−0.592, −0.407] is entirely negative and does not cross zero, and the p-value is effectively zero (p < 0.001), confirming this relationship is highly statistically significant and not a sampling artifact. However, the Granger causality tests tell a crucial story: neither direction (X→Y nor Y→X) achieves significance at any tested lag up to 10 periods (F = 1.41, p = 0.18 for X→Y; F = 1.08, p = 0.38 for Y→X). This means that while the variables are correlated, neither one temporally predicts the other — the relationship is associative, not directionally causal in any practical forecasting sense.
Notable Patterns, Clusters, and Outliers
Several features stand out in the sample points. There is a visible cluster of high trade counts (2,100–2,291) at lower NASDAQ index values (roughly 387,000–600,000), consistent with the crisis-recovery environment of early 2009 when volatility and trading frequency were elevated. Conversely, points at higher index values (750,000–848,000) tend to cluster in the 1,300–1,750 trade count range, suggesting late-2009 calming. Two points merit particular attention as potential outliers: the observation at X ≈ 185,887 (far left, well below the bulk of data) with a Y value of ~2,286 sits in extreme isolation from the main cloud, likely representing an anomalous low-volume trading day early in the year. Similarly, the point at X ≈ 387,119 with Y ≈ 2,291 represents one of the highest trade counts in the sample. The spread of Y values at any given X level is also quite wide (often spanning 500–800 trade count units), signaling substantial unexplained variability.
Confounding Factors and Caveats
Several important caveats apply. First, 2009 is a historically unusual year — the NASDAQ bottomed in March 2009 and then rallied sharply, meaning the index level is serving as a rough proxy for calendar time rather than an independent market signal. The negative correlation may largely capture the temporal narrative of crisis → recovery rather than a structural market relationship. Second, Tape C trade counts reflect only Cboe-routed NASDAQ trades, not total market activity, introducing a venue-specific selection bias. Third, market microstructure changes — including evolving algorithmic trading strategies, regulatory shifts post-2008, and changing market-maker behavior — could confound the relationship. The wide X-axis range (185,887 to 848,554) and the isolated low-X outlier also suggest potential data quality or non-trading-day issues worth investigating.
Actionable Insights and Further Investigation
Given the absence of Granger causality, practitioners should avoid using NASDAQ index levels as a predictive signal for Tape C trade volume in real-time trading or market-making models. Instead, further investigation should explore: (1) decomposing the time series to separate the trend component (which drives much of this correlation) from cyclical or volatility-driven volume spikes; (2) examining VIX or realized volatility as a potentially stronger and more causally coherent predictor of trade counts; (3) investigating the isolated outlier at X ≈ 185,887 to determine whether it represents a genuine observation or a data error; and (4) extending the analysis across multiple years to test whether the negative correlation is specific to 2009's recovery dynamic or persists structurally. A time-series decomposition or regime-switching model would likely better capture the non-linear, crisis-influenced nature of this dataset than a single linear regression.
X dataset: Cboe U.S. Equities Historical Market Volume Data 2009
Y dataset: NASDAQ Composite Index Daily (FRED)
Part of experiment: Daily - Cboe U.S. Equities Historical Market Volume Data 2009 vs NASDAQ Composite Index Daily (FRED)