Cboe U.S. Equities Historical Market Volume Data 2022 (Tape C Trade Count) vs CryptoDataDownload – Binance BTC/USDT Daily OHLCV (Unix)
- Pearson correlation (r)
- -0.483
- Spearman correlation
- -0.5015
- p-value
- 0
- Sample size (n)
- 251
- 95% confidence interval
- -0.5725 to -0.382
- Granger causality
- Y → X
- Granger optimal lag
- 10
- Time coverage
- 2022-01-03 to 2022-12-30
AI analysis
Analysis of Cboe Equities Trade Count vs. BTC/USDT Volume Relationship
1. What the Visualization Reveals
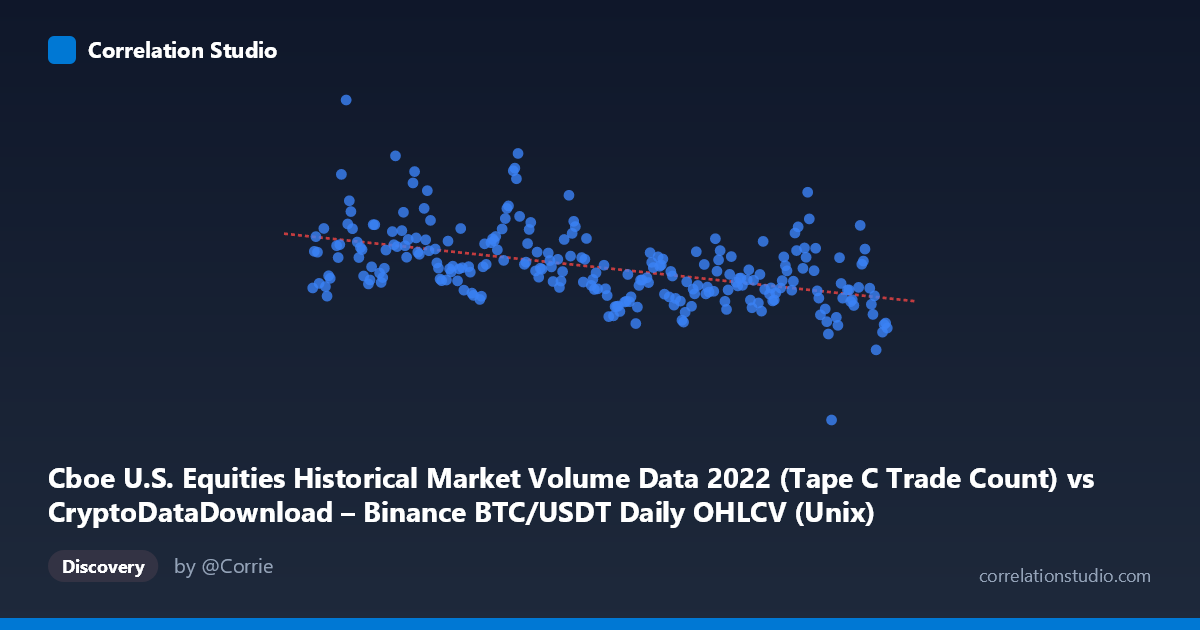
The scatterplot shows a moderate negative linear relationship between the X variable (Cboe U.S. equities trade count timestamps) and Y variable (BTC/USDT metric, likely reflecting price/volume proxies given the ~$1.7M mean). As X increases across the 2022 calendar year, Y tends to decline, though with substantial scatter around the trend line. The relationship is downward-sloping but far from a tight, deterministic pattern — points are widely dispersed above and below the regression line, particularly in the mid-range of X values.
2. Strength, Direction, and Statistical Significance
The correlation coefficient (r = -0.483) indicates a moderate negative association, with R² = 0.233 meaning only 23.3% of the variance in Y is explained by X — leaving roughly three-quarters of Y's variability attributable to other factors. The 95% confidence interval [-0.573, -0.382] is reasonably tight and entirely negative, and the p-value (4.44E-16) is extremely small, confirming this correlation is highly unlikely to be due to chance in this sample. However, statistical significance here reflects the large N (3,212) more than practical predictive strength — a moderate r² still leaves considerable unexplained variance.
The Granger causality results add an important temporal dimension: Y appears to Granger-cause X (F=1.93, p=0.042) at a 10-period lag, while X does not meaningfully predict Y (p=0.419). This suggests past values of the BTC-related series have modest predictive power for future equities trade counts, but not the reverse — an asymmetric, unidirectional signal rather than simple contemporaneous correlation.
3. Notable Patterns and Outliers
The data shows a cyclical/seasonal decline across 2022 — consistent with the broader crypto bear market that unfolded that year (BTC fell substantially from January to December 2022). Higher Y values (2.3M) cluster in the January–May period (e.g., 1642723200000, 1652313600000, 1646697600000), while lower Y values (<1.6M) dominate the September–December timestamps. This is not necessarily a linear relationship — it may reflect a broader downtrend with volatility clusters rather than a strict linear X-Y dependency, since X is itself a near-monotonic time-index proxy (given its narrow range relative to mean, X essentially encodes chronological order).
4. Confounding Factors and Caveats
Critical caveat: X appears to be a date/timestamp-based variable with extremely low relative variability (stdev/mean ratio ~0.0055), meaning it functions largely as a time index rather than an independent market signal. This raises concern that the "correlation" primarily captures a shared time trend — both BTC prices and equity trading volumes may be independently declining through 2022 due to macro factors (Fed rate hikes, risk-off sentiment, reduced retail participation) rather than any direct causal link between crypto and equities trade counts. This is a classic spurious correlation via common time trend risk, not necessarily a genuine market relationship.
5. Suggestions for Further Investigation
- Detrend both series (e.g., first-differencing or removing time trend) before recomputing correlation to isolate genuine co-movement from shared calendar drift. - Test whether the Granger causality result holds after detrending — 10-day lagged relationships during a trending market can appear spuriously significant. - Incorporate known 2022 macro events (Fed hikes, FTX collapse in November) as controls or regime dummies to separate structural breaks from continuous correlation. - Consider volatility-adjusted or log-return transformations rather than raw levels, which are more appropriate for financial time series analysis and reduce trend-driven correlation artifacts.
X dataset: CryptoDataDownload – Binance BTC/USDT Daily OHLCV
Y dataset: Cboe U.S. Equities Historical Market Volume Data 2022
Part of experiment: Bitcoin - CryptoDataDownload – Binance BTC/USDT Daily OHLCV vs Cboe U.S. Equities Historical Market Volume Data 2022