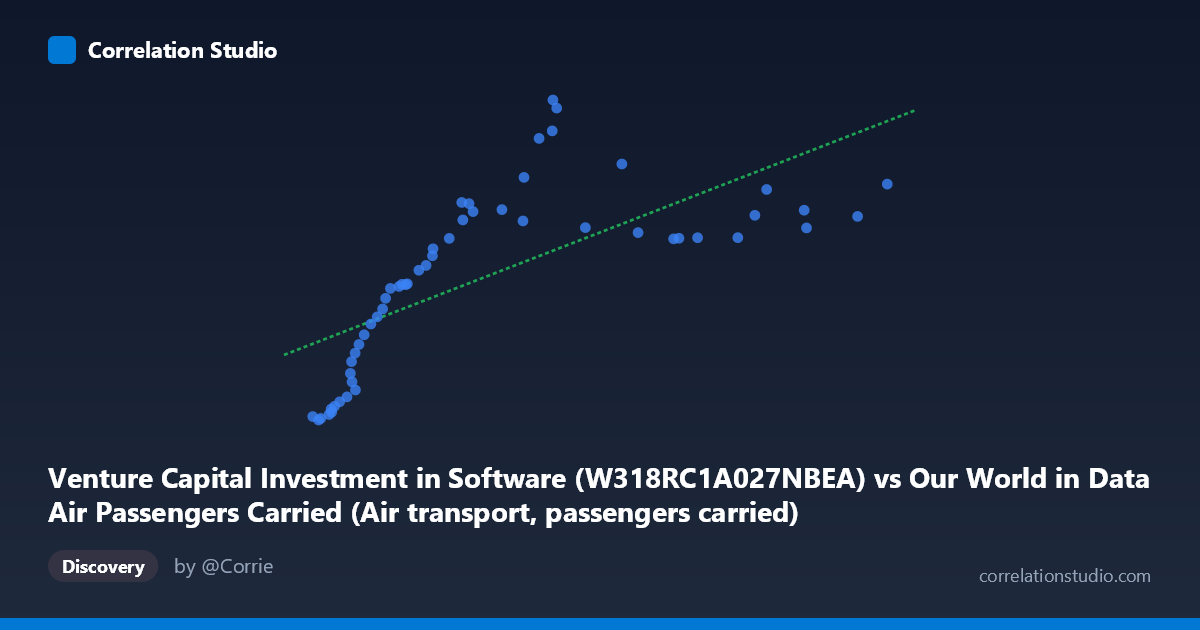
Venture Capital Investment in Software (W318RC1A027NBEA) vs Our World in Data Air Passengers Carried (Air transport, passengers carried)
- Pearson correlation (r)
- 0.6989
- Spearman correlation
- 0.886
- p-value
- 0
- Sample size (n)
- 54
- 95% confidence interval
- 0.5304 to 0.8143
- Granger causality
- None
- Granger optimal lag
- 10
- Time coverage
- 1970-01-01 to 2023-01-01
- Recomputed on refreshed data
- 2026-10-24 (r was 0.6985)
AI analysis
Scatterplot Analysis: Venture Capital Investment in Software vs. Air Passengers Carried
1. Overall Relationship Revealed
The scatterplot displays a positive, moderately strong relationship between Venture Capital Investment in Software and Air Passengers Carried across the 1970–2023 time period. As VC investment in software increases, air passenger volumes tend to rise as well. However, the relationship is visibly heteroscedastic — the spread of Y values widens considerably at higher X values, suggesting the linear model increasingly loses precision as VC investment grows. The data also appears to follow a curved trajectory rather than a strict straight line, consistent with the note that Spearman ρ exceeds Pearson r, hinting that a logarithmic or polynomial fit would better characterize the underlying pattern.
2. Correlation Strength, Direction, and Causality
The Pearson correlation of r = 0.699 indicates a moderate-to-strong positive association, but the coefficient of determination r² = 0.488 means that only 48.8% of the variance in air passengers is statistically explained by VC software investment — leaving more than half the variance attributable to other factors. The 95% confidence interval [0.530, 0.814] is reasonably tight and excludes zero, and the p-value of 4.28 × 10⁻⁹ confirms the correlation is highly statistically significant and extremely unlikely to be a chance artifact given n = 54. Despite this significance, the Granger causality tests show no significant temporal predictive direction in either direction (X→Y: F = 0.479, p = 0.887; Y→X: F = 1.257, p = 0.310). This is a critical finding: even though the two variables move together, neither one temporally predicts the other at any lag up to 10 periods. This strongly cautions against any causal interpretation — the correlation almost certainly reflects shared dependence on a common underlying driver (likely broad economic expansion over time) rather than a genuine mechanistic link.
3. Notable Patterns, Clusters, and Outliers
The data naturally clusters into two distinct regions: a dense lower-left cluster (VC investment below ~$30M, passengers below ~250) representing earlier decades with low investment and travel volumes, and a more dispersed upper-right region representing the post-2000 era of accelerating software investment and mass air travel. Several notable outliers are visible in the moderate X range (~$55–65M) where Y values spike dramatically — the points near (57.8M, 412), (60.8M, 466), and (60.7M, 423) sit well above the regression line, suggesting these years experienced unusually high passenger growth relative to VC investment levels. Conversely, several high-X points such as (127.7M, 302) and (116.5M, 286) fall well below the regression line, implying that very high VC investment in later years did not always coincide with proportionally high passenger counts — possibly reflecting COVID-era disruptions (2020–2021) suppressing travel while investment continued.
4. Confounding Factors and Caveats
This correlation is almost certainly a spurious time-trend correlation — both variables grew substantially over the 1970–2023 period driven by global economic development, population growth, urbanization, and technological advancement. Any two metrics that trend upward over this period would exhibit similar correlations. The column labeling anomaly (the axis descriptions appear swapped in the dataset names) introduces interpretive ambiguity and warrants verification of which data series is actually being plotted on each axis. Additionally, COVID-19's impact (2020–2021) likely created structural breaks in air travel data that could distort regression parameters, potentially explaining the above-mentioned outliers where high VC investment accompanies relatively low passenger numbers. The optimal Granger lag of 10 periods further suggests that any apparent relationship operates on decade-long timescales — consistent with a shared secular trend rather than a direct mechanism.
5. Actionable Insights and Further Investigation
Given the likely spurious nature of this correlation, the most productive next step would be to detrend both series (e.g., using first differences or year-over-year percentage changes) and re-examine whether any residual correlation persists — a genuine relationship should survive detrending while a time-trend artifact should not. A logarithmic or power-law regression should be tested given the Spearman Pearson signal, which may better capture the diminishing marginal relationship visible in the scatter. Investigators should also control for confounders such as GDP, global oil prices, and internet/e-commerce adoption, which plausibly link both variables independently. Finally, segmenting the data by era (pre-2000, 2000–2015, post-2015) or explicitly modeling the COVID structural break could reveal whether the relationship has changed character over time, providing more actionable insight into whether digital investment and physical mobility are genuinely complementary economic phenomena.
X dataset: Our World in Data Air Passengers Carried
Y dataset: Venture Capital Investment in Software
Part of experiment: Yearly - Our World in Data Air Passengers Carried vs Venture Capital Investment in Software