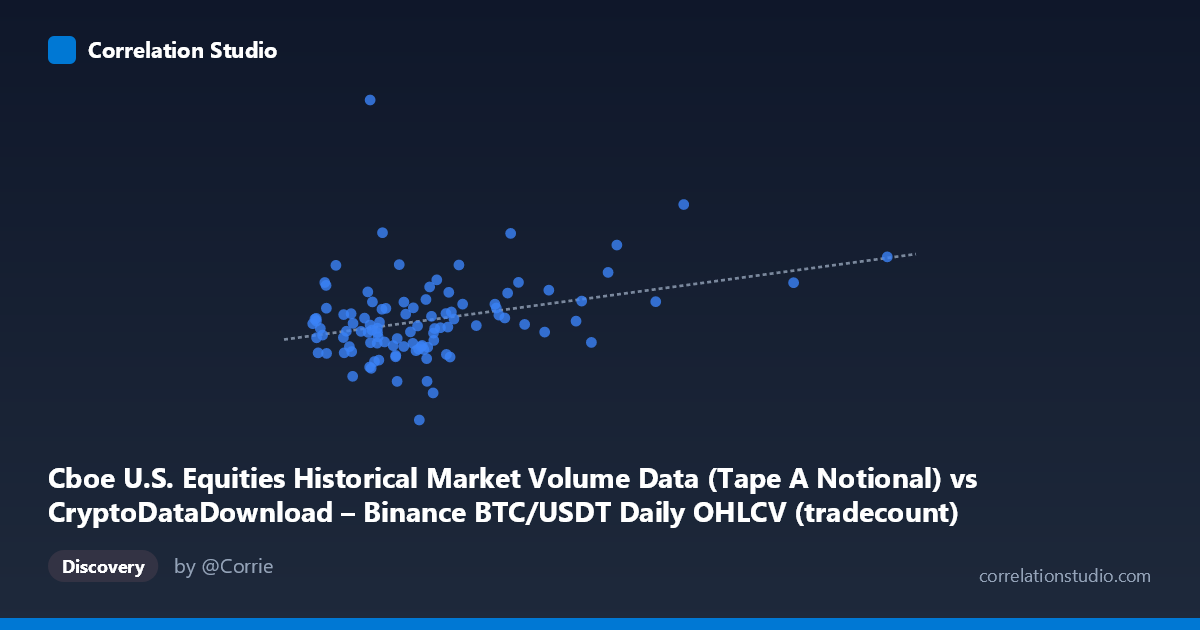
Cboe U.S. Equities Historical Market Volume Data (Tape A Notional) vs CryptoDataDownload – Binance BTC/USDT Daily OHLCV (tradecount)
- Pearson correlation (r)
- 0.3226
- Spearman correlation
- 0.2737
- p-value
- 0.000839
- Sample size (n)
- 104
- 95% confidence interval
- 0.1386 to 0.485
- Granger causality
- None
- Granger optimal lag
- 10
- Time coverage
- 2026-01-02 to 2026-06-25
- Recomputed on refreshed data
- 2026-10-24 (r was 0.3226)
AI analysis
Analysis: Cboe Equities Volume vs. Binance BTC/USDT Tradecount
1. Overall Relationship
The scatterplot shows a moderate positive relationship between the two variables: as the X variable (Cboe U.S. Equities Tape A Notional Volume) increases, Y (Binance BTC/USDT tradecount) tends to increase as well, though with considerable scatter. Most observations cluster tightly in the lower-X range (roughly 2.2M–6M), with a sparser tail of higher-X values (7M–15.4M) that appear to pull the trend line upward. The relationship is far from a tight linear band — there's substantial vertical spread at any given X value, particularly in the dense cluster below X=6M, where Y ranges from ~10B to ~21B.
2. Strength, Direction, and Statistical Confidence
The correlation coefficient (r = 0.446) indicates a moderate positive linear relationship, but r² = 0.199 tells the more important story: only about 20% of the variance in tradecount is explained by equities volume, leaving 80% attributable to other factors or noise. The 95% CI [0.263, 0.598] is fairly wide but stays entirely positive and excludes zero, and the p-value (1.045E-05) is highly significant — so we can be confident a real, non-zero positive association exists, even though its magnitude is modest and imprecisely pinned down.
The Granger causality results add a temporal dimension: X (equities volume) Granger-causes Y (BTC tradecount) at a 10-period lag (F=2.63, p=0.010), while the reverse (Y→X) is not significant (p=0.14). This suggests a unidirectional predictive relationship — past equities volume has modest but statistically detectable predictive power for future BTC trade activity, but not vice versa. This is consistent with a market-linkage or lead-lag story rather than reverse causation, though Granger causality reflects predictive association, not true mechanistic causality.
3. Notable Patterns and Outliers
Several points stand out: the lowest Y value (~10.09B) occurs at a mid-range X (~4.7M), and a few high-Y outliers (19B, e.g., ~21.3B, 20.6B, 23.0B) appear scattered across both low and high X values, indicating volatility spikes in BTC trading that aren't well-predicted by equities volume alone. The three highest-X points (10.7M, 13.2M, 15.4M) do trend toward higher Y values (18–23B), lending support to the positive slope, but with only 3-4 points in this region, they have outsized leverage on the regression fit and warrant scrutiny as potential high-influence observations rather than robust confirmation of linearity across the full range.
4. Confounding Factors and Caveats
Several caveats limit causal interpretation. First, both series may be driven by a common macro factor — overall market volatility, risk sentiment, or trading-day volume cycles — that inflates both equities notional volume and crypto trade counts simultaneously (spurious correlation via a shared driver). Second, the mismatch in units and asset classes (equities dollar notional vs. crypto trade counts) means the relationship may reflect broad "market activity" co-movement rather than a direct economic link. Third, n=90 paired points sampled from a larger population (N=1,980) may not fully capture seasonality, day-of-week effects, or regime shifts (e.g., BTC volatility clusters) that could distort both the correlation and the Granger test. Finally, the low R² means the linear model (y = 409.98x + 1.38287E10) has limited practical predictive value on its own.
5. Suggestions for Further Investigation
Given the modest R² and the influential high-X outliers, it would be valuable to: (a) test the regression with and without the top 3-4 X-value points to check robustness of the slope; (b) explore whether a log-transform or non-linear model fits better, given the heavy left-skew in X; (c) investigate shared macro covariates (e.g., VIX, overall crypto market volume, or day-of-week/session effects) to rule out confounding; and (d) extend the Granger analysis with additional lags and control variables to strengthen the case for a genuine lead-lag relationship. Given the significant but weak Granger result, this may be more useful as a directional signal (equities volume as a leading indicator) within a multi-factor model rather than as a standalone predictor.
X dataset: CryptoDataDownload – Binance BTC/USDT Daily OHLCV
Y dataset: Cboe U.S. Equities Historical Market Volume Data
Part of experiment: Bitcoin - CryptoDataDownload – Binance BTC/USDT Daily OHLCV vs Cboe U.S. Equities Historical Market Volume Data