Bank Prime Loan Rate (DPRIME) (DPRIME) vs Bitcoin Historical Price USD – All-Time Series (Habrador) (Price)
- Pearson correlation (r)
- 0.6695
- Spearman correlation
- 0.6595
- p-value
- 0
- Sample size (n)
- 3985
- 95% confidence interval
- 0.652 to 0.6863
- Granger causality
- None
- Granger optimal lag
- 1
- Time coverage
- 2010-07-19 to 2026-04-28
- Recomputed on refreshed data
- 2026-10-15 (r was 0.6695)
AI analysis
Analysis of Bitcoin Price vs. Bank Prime Loan Rate
1. What the Visualization Reveals
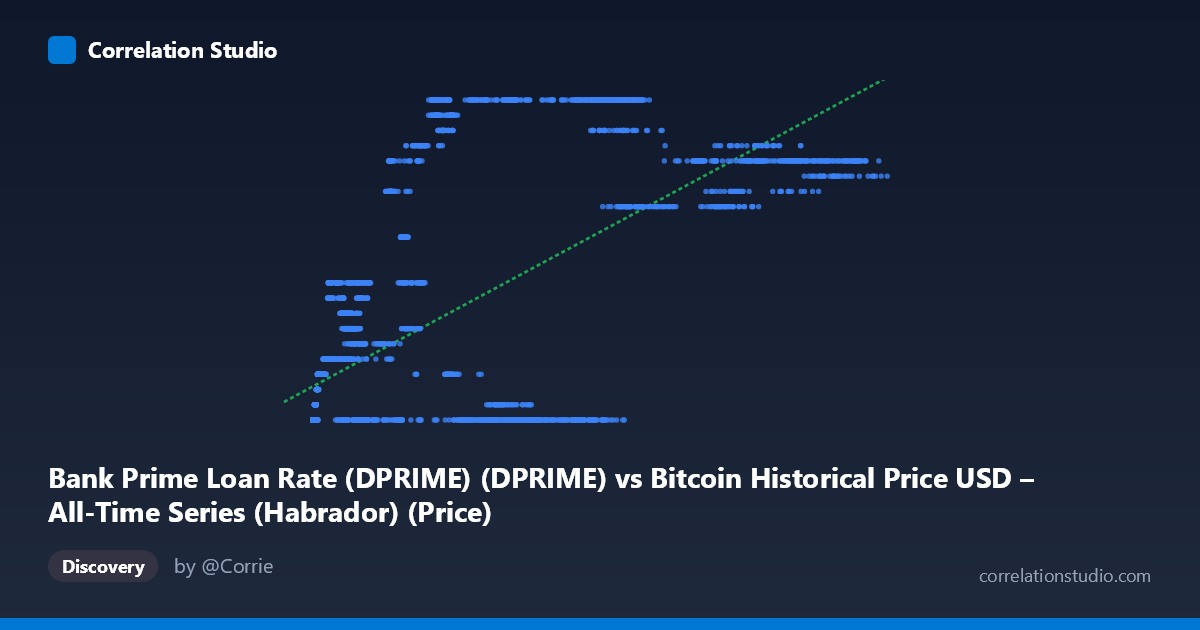
This scatterplot presents an unusual pairing: Bitcoin's historical USD price (X-axis) plotted against the Bank Prime Loan Rate (Y-axis). Despite the axis labels being somewhat swapped in the metadata description, the data structure shows Bitcoin price values ranging enormously (from $0.05 to $124,720) against prime rate values clustered in a narrow band (3.25% to 8.50%). The scatter shows a clear positive but non-linear pattern: low Bitcoin prices (under ~$1,000) correspond almost exclusively to the lowest prime rate (3.25%), while high Bitcoin prices ($100,000) correspond to elevated rates (7.0–7.5%).
2. Strength, Direction, and Statistical Confidence
The correlation coefficient (r = 0.6695, r² = 0.448) indicates a moderately strong positive relationship, with Bitcoin price explaining about 45% of the variance in the prime rate — leaving over half unexplained by this linear model. The narrow 95% CI [0.652, 0.686] and p-value ≈ 0 confirm this correlation is highly statistically reliable and not due to chance, given the large sample (n=3,985). However, statistical significance here reflects the size of the dataset and shared upward trends over time, not necessarily a meaningful causal linkage. Critically, the Granger causality tests show no significant predictive direction in either direction (X→Y: p=0.199; Y→X: p=0.280) at a 1-period lag. This means neither variable reliably predicts future movements in the other — the relationship is contemporaneous/coincidental in timing, not a leading-lagging dynamic.
3. Notable Patterns and Outliers
The data shows strong clustering rather than a smooth linear spread: - A dense cluster at low Bitcoin prices (<$50,000) paired almost entirely with the 3.25% prime rate (the near-zero-rate era of 2010–2015 and 2020–2022). - A secondary cluster where mid-range Bitcoin prices ($5,000–$10,000) pair with rates around 5.0–5.5%. - A high-price cluster ($100,000+) pairing with rates of 7.0–7.5%, reflecting the 2024–2025 period. - The relationship looks more like a step-function or logarithmic curve than a straight line — rates stayed flat near 3.25% for years while Bitcoin fluctuated wildly, then jumped stepwise as Fed policy shifted, coinciding with (but not driving) Bitcoin's later bull runs.
4. Confounding Factors and Caveats
This is very likely a spurious correlation driven by mutual time-trending, not a genuine economic relationship. Both variables have undergone secular trends over the 2010–2026 window: the prime rate rose due to Federal Reserve tightening cycles (independent of crypto markets), while Bitcoin appreciated due to adoption, speculation, and halving cycles. Any two time series that both trend upward over the same period will show inflated correlation without genuine causal linkage. Additionally, Bitcoin's price is heavily right-skewed (mean $20,984 vs. median much lower, given the range), so the linear regression is disproportionately influenced by a handful of extreme high-price observations from 2024–2025.
5. Suggestions for Further Investigation
- Detrend both series (e.g., using differencing, log-returns, or residuals from time trend) before correlating, to test whether any real relationship survives after removing the shared time trend. - Log-transform Bitcoin price given its exponential growth pattern, which may better linearize the relationship and improve model fit. - Investigate rate regimes (near-zero 2010–2015, 2020–2021 vs. hiking cycles 2022–2024) as categorical predictors rather than continuous ones. - Given the null Granger causality result, avoid using one series to forecast the other; instead, treat both as separately driven by macroeconomic conditions (Fed policy) and crypto-specific catalysts (halvings, ETF approvals, adoption), respectively.
X dataset: Bitcoin Historical Price USD – All-Time Series (Habrador)
Y dataset: Bank Prime Loan Rate (DPRIME)
Part of experiment: Bitcoin - Bitcoin Historical Price USD – All-Time Series (Habrador) vs Bank Prime Loan Rate (DPRIME)