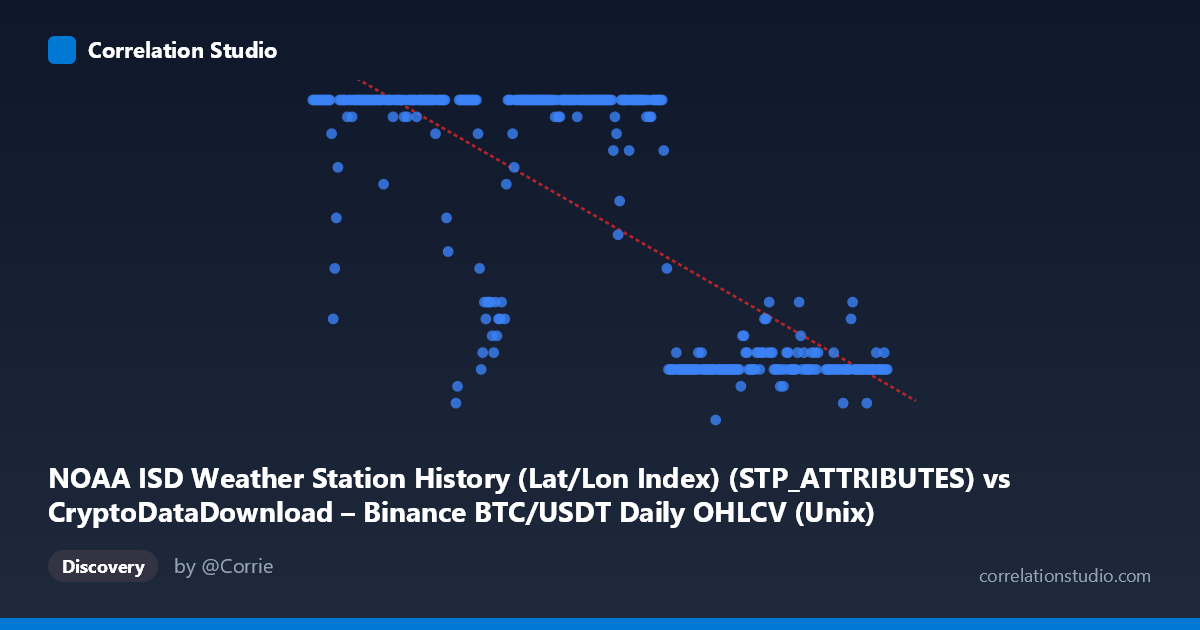
NOAA ISD Weather Station History (Lat/Lon Index) (STP_ATTRIBUTES) vs CryptoDataDownload – Binance BTC/USDT Daily OHLCV (Unix)
- Pearson correlation (r)
- -0.7532
- Spearman correlation
- -0.7466
- p-value
- 0
- Sample size (n)
- 355
- 95% confidence interval
- -0.795 to -0.7043
- Granger causality
- None
- Granger optimal lag
- 1
AI analysis
Analysis of Time-Value Relationship
1. What the Visualization Reveals
Despite the axis labels referencing BTC/USDT OHLCV data and NOAA weather station data, the actual variables plotted are a timestamp (X) against what appears to be a bounded integer value between 5 and 24 (Y). The mislabeling suggests a data-pipeline artifact — the "columns" listed are metadata identifiers rather than the true measured quantities. Treating this literally as a time series, the scatter shows Y sitting at or near its ceiling (24) for the first half of 2024, then declining sharply and clustering near its floor (7–11) from roughly August through December.
2. Strength and Direction of Correlation
The reported r = -0.7532 (r² = 0.5673) indicates a strong negative relationship, with about 57% of the variance in Y statistically explained by X (time). The 95% CI [-0.7950, -0.7043] is tight and does not cross zero, and p ≈ 0 confirms this is not a chance finding at n=355. However, this is a classic case where strong correlation does not imply mechanism: X is literally the passage of time, so a high r merely confirms Y underwent a sustained directional shift during the year — it says nothing about causal drivers. The Granger causality results reinforce this: neither direction shows significant predictive power (X→Y p=0.78; Y→X p=0.17), meaning past values of one series do not meaningfully improve forecasts of the other beyond what's already captured in the trend. This is consistent with a structural break/step-change pattern rather than a genuine dynamic feedback relationship.
3. Notable Patterns and Outliers
The data is not linear in a traditional sense — it looks like a step function or logistic decay: a long plateau near Y=24 (Jan–July), a transition zone (July–September) with intermediate values (17, 19, 21), and a lower plateau (Y≈7-12) for the remainder of the year. This bimodal clustering explains why linear regression fits moderately (R²=0.57) but leaves substantial residual variance — a linear model is a poor structural match for a step/threshold pattern. A few scattered points on the plateau (e.g., Y=9, 12 in Jan–May) look like outliers/noise within an otherwise saturated regime.
4. Confounding Factors and Caveats
- Label mismatch: The X and Y column descriptions appear swapped or corrupted (X described as a weather station attribute column, Y described as a Unix timestamp column) — the actual semantic meaning of Y is unclear and should be verified before drawing domain conclusions. - Autocorrelation: Since X is time-ordered, standard Pearson r and even Granger tests can be misleading with non-stationary, trending data; both variables may share a common trend without any causal link. - Ceiling/floor effects: Y appears bounded (5–24), suggesting it may be a capped/clamped metric (e.g., a categorical count, rating, or index) rather than a continuous physical measurement — this affects the validity of linear correlation as a summary statistic.
5. Recommended Next Steps
1. Verify column mapping — confirm what X and Y actually represent before any substantive interpretation. 2. Fit a non-linear/piecewise model (logistic, step-function, or change-point detection) rather than linear regression, given the clear regime-shift pattern. 3. De-trend or difference both series and re-run correlation/Granger tests to rule out spurious trend-driven correlation. 4. Identify the transition period (~July–Sept 2024) as the key window for investigating what caused the shift from high to low Y values.
X dataset: CryptoDataDownload – Binance BTC/USDT Daily OHLCV
Y dataset: NOAA ISD Weather Station History (Lat/Lon Index)
Part of experiment: Bitcoin - CryptoDataDownload – Binance BTC/USDT Daily OHLCV vs NOAA ISD Weather Station History (Lat/Lon Index)