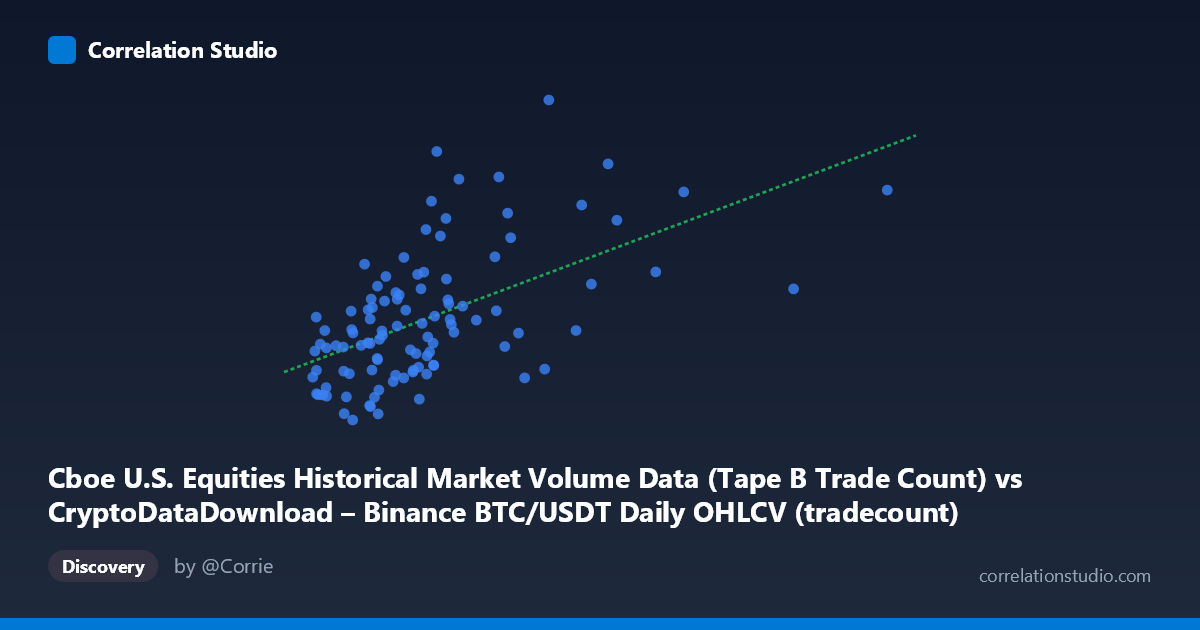
Cboe U.S. Equities Historical Market Volume Data (Tape B Trade Count) vs CryptoDataDownload – Binance BTC/USDT Daily OHLCV (tradecount)
- Pearson correlation (r)
- 0.5566
- Spearman correlation
- 0.5555
- p-value
- 0
- Sample size (n)
- 104
- 95% confidence interval
- 0.4077 to 0.6766
- Granger causality
- None
- Granger optimal lag
- 10
- Time coverage
- 2026-01-02 to 2026-06-25
- Recomputed on refreshed data
- 2026-10-24 (r was 0.5566)
AI analysis
Analysis of the Relationship Between Cboe Tape B Trade Count and Binance BTC/USDT Trade Count
1. Overview of the Relationship
The scatterplot shows a positive, moderately strong linear association between the two variables: as Cboe Tape B trade counts increase, Binance BTC/USDT trade counts also tend to rise. Most observations cluster tightly in the lower-left region (X between 2.3M–6M, Y between 650K–1.4M), forming a dense core that drives the overall trend. A smaller number of points extend rightward toward higher X values (up to ~15.4M), which have outsized leverage on the fitted regression line.
2. Strength, Direction, and Statistical Confidence
The correlation coefficient (r = 0.578) indicates a moderate positive relationship, with r² = 0.334 meaning only about a third of the variance in Y is explained by X — leaving roughly two-thirds attributable to other factors or noise. The 95% CI [0.421, 0.701] is reasonably wide, reflecting sample-size limitations (n=90 paired points drawn from a longer 1,980-day series), but it excludes zero, and the extremely small p-value (2.5×10⁻⁹) confirms the correlation is highly unlikely to be due to chance. However, statistical significance should not be conflated with practical predictive strength — with only 33% shared variance, X is a weak-to-moderate standalone predictor of Y. Critically, the Granger causality tests show no significant predictive direction in either direction (X→Y: p=0.94; Y→X: p=0.82) at the optimal lag of 10 periods. This means neither series helps forecast the other's future values based on past values — the contemporaneous correlation does not imply any lead-lag temporal relationship.
3. Notable Patterns and Outliers
The bulk of the data forms a fairly homogeneous cloud with a gentle upward slope, but several high-leverage points stand out: the observation near (15.36M, 1.48M) is a strong X-outlier, and points like (7.65M, 1.81M) and (9.0M, 1.58M) show elevated Y values disproportionate to their X values, suggesting some non-linearity or heteroscedasticity — variance in Y appears to increase as X increases (a fan-shaped spread), which is common in volume/trade-count data across markets. There's no clear evidence of multiple clusters or regime segments, but the relationship may not be strictly linear at the extremes; a log-log or rank-based transformation might reveal a tighter, more monotonic relationship less influenced by high-magnitude outliers.
4. Confounding Factors and Caveats
Both variables are trade/volume counts tied to overall market activity, so a major confound is a shared underlying driver: broad market-wide volatility, macroeconomic news, or trading calendar effects (e.g., low-volume holidays, weekends when crypto trades but equities don't) could inflate both series simultaneously without any direct causal link between Binance crypto activity and Cboe equity activity. Additionally, comparing a 24/7 crypto market to a business-hours equity tape introduces structural mismatches — daily aggregation may mask intraday dynamics or timezone misalignments. The short time window (Jan–May 2026, ~90 sampled days from 1,980 total) may also not capture longer-term regime shifts, and the sampling ratio (90 of 1,980) suggests potential aliasing if the sampling isn't strictly random or evenly spaced.
5. Recommendations for Further Investigation
Given the lack of Granger causality, treat this as a contemporaneous co-movement rather than a predictive relationship — do not use one series to forecast the other in a trading or forecasting model. Useful next steps: (a) test for a common latent factor (e.g., a crypto-equity volatility index or macro liquidity proxy) using a three-variable VAR or factor model; (b) apply log transformations to reduce heteroscedasticity and re-assess correlation/R²; (c) examine whether removing the extreme X-outlier (~15.36M) materially changes r² and slope, since a single point can heavily distort OLS estimates in a sample this small; and (d) extend the analysis to the full 1,980-day population to verify whether the 90-day subsample is representative, and consider a rolling-window correlation to check for time-varying relationship strength across the covered period.
X dataset: CryptoDataDownload – Binance BTC/USDT Daily OHLCV
Y dataset: Cboe U.S. Equities Historical Market Volume Data
Part of experiment: Bitcoin - CryptoDataDownload – Binance BTC/USDT Daily OHLCV vs Cboe U.S. Equities Historical Market Volume Data