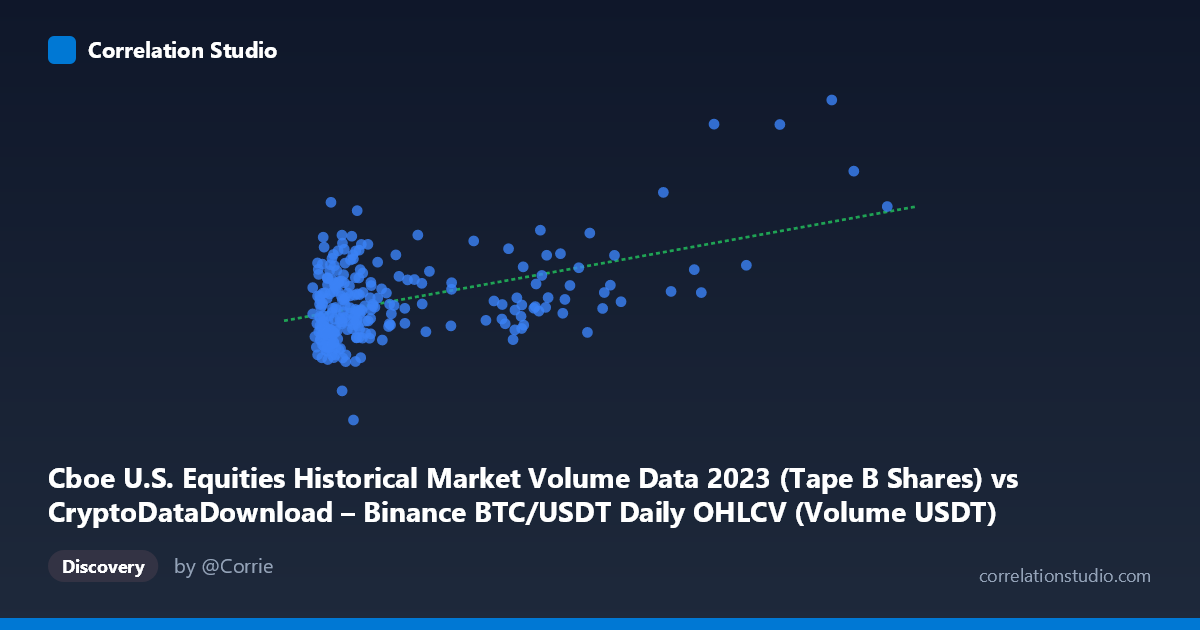
Cboe U.S. Equities Historical Market Volume Data 2023 (Tape B Shares) vs CryptoDataDownload – Binance BTC/USDT Daily OHLCV (Volume USDT)
- Pearson correlation (r)
- 0.4726
- Spearman correlation
- 0.2945
- p-value
- 0
- Sample size (n)
- 250
- 95% confidence interval
- 0.3702 to 0.5636
- Granger causality
- None
- Granger optimal lag
- 10
AI analysis
Analysis: Cboe Equities Volume vs. Binance BTC/USDT Volume
1. Overview of the Relationship
The scatterplot shows a positive but noisy relationship between two mismatched volume series (note: the axis labels appear swapped in the metadata — X is described as Cboe equities volume while the data range/values clearly correspond to BTC/USDT volume in USDT, and Y behaves like the equities series). Regardless of labeling, the data show a classic heteroscedastic fan pattern: at low X values (~500M–2B), Y is tightly clustered between roughly 75M–130M, while as X increases beyond 5B, the spread in Y narrows again but shifts slightly. Most of the 250 points cluster in the lower-left quadrant (X < 2B), with a sparse tail of high-X outliers (up to 17.5B) that have disproportionate leverage on the fitted line.
2. Strength, Direction, and Statistical Confidence
The correlation coefficient (r = 0.473) indicates a moderate positive linear relationship, but r² = 0.223 means only ~22% of the variance in Y is explained by X — the remaining ~78% is driven by other factors or noise. The 95% CI [0.370, 0.564] is reasonably tight and excludes zero, and the p-value (2.67e-15) confirms this correlation is highly unlikely to be due to chance given n=250. However, statistical significance here reflects sample size, not practical predictive strength — a moderate r² means this relationship has limited standalone forecasting value. Critically, the Granger causality tests show no significant predictive direction in either direction (X→Y: p=0.697; Y→X: p=0.821). This means that despite the contemporaneous correlation, neither series is dynamically useful for forecasting the other's future values — the relationship is likely coincidental co-movement (e.g., both trending upward over the year) rather than a lead-lag mechanism.
3. Patterns, Clusters, and Outliers
The data reveals: - A dense cluster of ~180 points with X between 500M–2B and Y between 75M–130M, suggesting "typical" daily trading days for both markets. - A sparse right tail: points like (13.3B, 117.8M), (17.5B, ...), and (9.1B, 104.5M) represent high-volume Bitcoin trading days (likely news-driven volatility spikes) that don't correspond to proportionally higher equities volume — these are high-leverage points that inflate the linear slope despite weak local correlation. - One clear outlier: (1.69B, 42.0M) — a Y value far below the cluster floor (~75M), potentially a low-volume holiday or data anomaly (worth flagging, possibly a low-liquidity trading day). - The residual spread suggests a logarithmic or saturating relationship may fit better than linear, since Y plateaus while X continues to grow across orders of magnitude (500M to 17B).
4. Confounding Factors and Caveats
Several caveats limit causal interpretation: - Spurious correlation from shared time trends: Both crypto and equities markets experienced macro-driven volume shifts in 2023 (rate hikes, banking stress in March, year-end rallies) that could inflate correlation without any direct economic link. - Scale mismatch: X spans over 35x its lower bound while Y varies by less than 5x — this asymmetry means the linear model is heavily influenced by a handful of extreme X values rather than reflecting the bulk of the data. - No adjustment for volatility regimes, day-of-week effects, or macro announcement days, which independently drive volume in both crypto and equities markets. - Different market structures (23/7 crypto trading vs. equities session-bound trading) may cause volume metrics to be non-comparable without normalization.
5. Recommendations for Further Investigation
- Apply a log transform to X (and possibly Y) before regression, given the multiple-order-of-magnitude spread in Bitcoin volume — this may reveal a cleaner, more interpretable relationship and improve model fit. - Test for common confounders (e.g., VIX, day-of-week dummies, macro event calendars) using multivariate regression to see if the r² holds after controlling for shared drivers. - Investigate the identified outliers (especially the 42M Y value) to confirm they aren't data errors. - Given the lack of Granger causality, do not use this relationship for trading signal generation in a lead-lag strategy; instead, treat it as a descriptive/contemporaneous co-movement pattern only. - Consider rolling-window correlation analysis to check if the relationship strengthens/weakens during specific volatility regimes (e.g., March 2023 banking crisis) rather than assuming a stable year-round relationship.
X dataset: CryptoDataDownload – Binance BTC/USDT Daily OHLCV
Y dataset: Cboe U.S. Equities Historical Market Volume Data 2023
Part of experiment: Bitcoin - CryptoDataDownload – Binance BTC/USDT Daily OHLCV vs Cboe U.S. Equities Historical Market Volume Data 2023