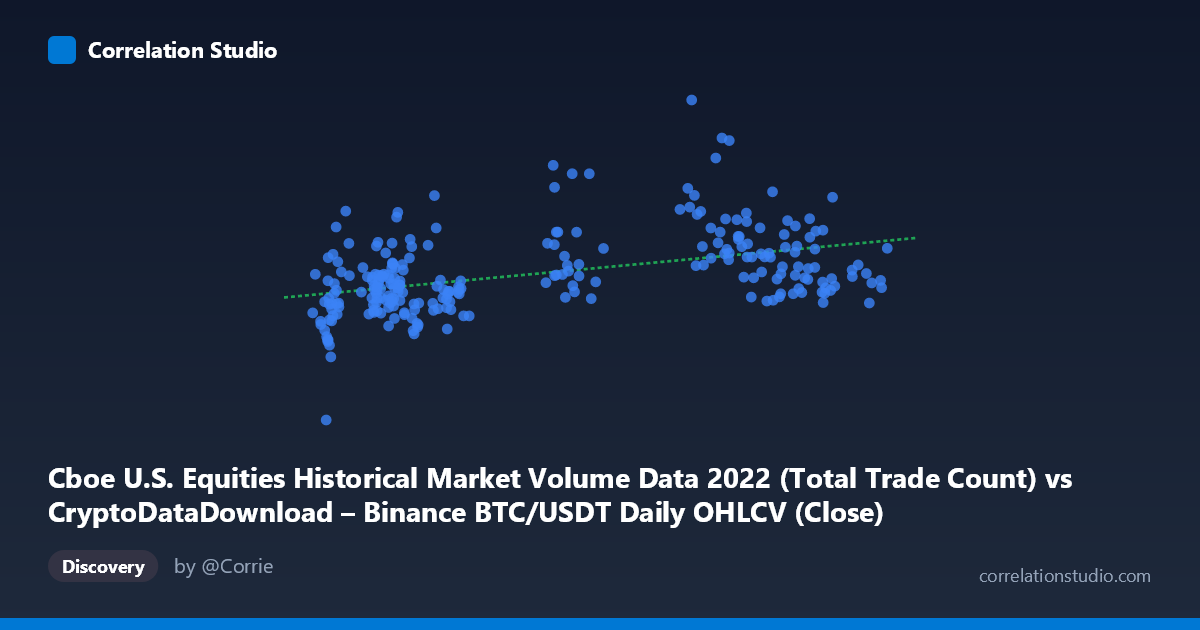
Cboe U.S. Equities Historical Market Volume Data 2022 (Total Trade Count) vs CryptoDataDownload – Binance BTC/USDT Daily OHLCV (Close)
- Pearson correlation (r)
- 0.4378
- Spearman correlation
- 0.4452
- p-value
- 0
- Sample size (n)
- 251
- 95% confidence interval
- 0.332 to 0.5328
- Granger causality
- None
- Granger optimal lag
- 10
AI analysis
Analysis: Cboe Equities Trade Count vs. BTC/USDT Close Price (2022)
1. Relationship Overview
The scatterplot shows a weak-to-moderate positive relationship between U.S. equities trade counts (X) and Bitcoin's closing price (Y) throughout 2022. Points are widely dispersed around the regression line (y = 29.83x + 3,236,320), with substantial scatter at every level of X. There is no clean linear band; instead, the data forms a loose, fan-shaped cloud that widens noticeably as X increases, suggesting heteroscedasticity rather than a tight linear coupling.
2. Strength, Direction, and Statistical Confidence
The correlation coefficient (r = 0.438) indicates a modest positive association, and r² = 0.192 tells us that equities trade volume explains only about 19% of the variance in BTC price — leaving over 80% attributable to other factors. The 95% CI [0.332, 0.533] is reasonably tight and excludes zero, and the p-value (3.5×10⁻¹³) confirms this correlation is highly unlikely to be due to chance in this sample. However, statistical significance here reflects sample size and consistency of a weak effect, not practical strength — r² near 0.19 is not a basis for predictive confidence in either direction. Critically, the Granger causality tests (F = 0.76, p = 0.67 for X→Y; F = 1.24, p = 0.27 for Y→X) find no significant lead-lag predictive relationship at the optimal 10-period lag. This means neither series reliably anticipates the other over time — the contemporaneous correlation does not translate into temporal forecasting power in either direction.
3. Patterns, Clusters, and Outliers
Several notable features stand out: - Low-X cluster (X ≈ 16,000–23,000): Densely packed points with Y ranging broadly from ~3.2M to ~5.1M, showing high price variability even when trade counts are low and stable — this is where most of the "noise" originates. - High-Y outliers: Points like (38730.63, 6,397,686) and (29029.75, 5,965,975) sit well above the main cloud, representing likely BTC price spikes (early-year highs) not matched by proportionally high equity trade counts. - Fan/cone shape: Variance in Y appears to increase somewhat with X, hinting at non-constant variance rather than a strictly linear signal. - No evidence of a curved (non-linear) relationship — the pattern looks more like scattered noise around a shallow slope than a systematic curve.
4. Confounding Factors and Caveats
This correlation is likely spurious or indirect rather than causal: - Both series are driven by macro conditions in 2022 (Fed rate hikes, inflation data, risk-off sentiment) that pushed both equity trading activity and crypto prices in overlapping but not necessarily synchronized directions. - BTC price and equity trade counts are fundamentally different metrics (price level vs. transaction volume) — comparing a price series to a volume series conflates scale and units, which can produce artifactual correlation. - Neither series is stationary in 2022 (both trended over the year), and correlating two non-stationary time series is a classic source of inflated/spurious r values. - N (3,212) vs. n (251) suggests substantial subsampling or date-matching filtering — sampling methodology could introduce selection bias.
5. Suggested Next Steps
- Detrend or difference both series (e.g., use daily returns/changes rather than levels) before correlating, to remove shared macro trend effects and test if the relationship holds. - Control for known confounders — VIX, Fed rate decisions, or overall market liquidity — via multiple regression or partial correlation. - Given the null Granger result, do not use one series to forecast the other; instead, treat any co-movement as coincidental/macro-driven rather than a tradeable lead-lag signal. - Investigate the high-Y outlier events directly (news/calendar cross-check) to see if they correspond to specific volatility events (e.g., LUNA/FTX collapse) that decoupled BTC price from equity activity. - Consider a nonlinear or volume-weighted volatility measure for BTC instead of raw close price, which may align more naturally with equity trade count as an "activity" metric.
X dataset: CryptoDataDownload – Binance BTC/USDT Daily OHLCV
Y dataset: Cboe U.S. Equities Historical Market Volume Data 2022
Part of experiment: Bitcoin - CryptoDataDownload – Binance BTC/USDT Daily OHLCV vs Cboe U.S. Equities Historical Market Volume Data 2022