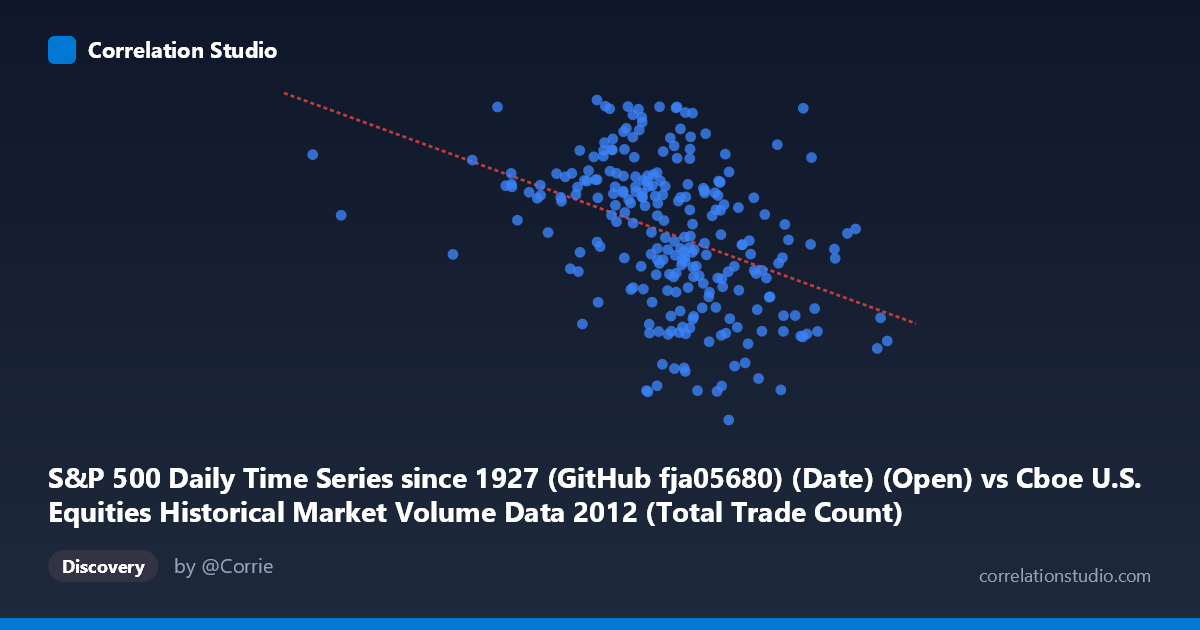
S&P 500 Daily Time Series since 1927 (GitHub fja05680) (Date) (Open) vs Cboe U.S. Equities Historical Market Volume Data 2012 (Total Trade Count)
- Pearson correlation (r)
- -0.4016
- Spearman correlation
- -0.46
- p-value
- 0
- Sample size (n)
- 250
- 95% confidence interval
- -0.5007 to -0.2921
- Granger causality
- None
- Granger optimal lag
- 1
AI analysis
Analysis: S&P 500 Opening Price vs. U.S. Equities Total Trade Count (2012)
Relationship Overview The scatterplot reveals a moderate negative relationship between the S&P 500 daily opening price (X) and the total trade count across U.S. equities exchanges (Y) throughout 2012. As the S&P 500 opened at higher price levels, total market trade counts tended to decline. The linear regression equation (y = -7.97×10⁻⁵x + 1,509.89) quantifies this inverse slope, suggesting that for every 10,000-point increase in the S&P 500 opening value, total trade count decreases by approximately 0.8 units on the Y scale — reflecting a gradual but consistent dampening of trading activity as equity prices rose over the year.
Correlation Strength and Statistical Significance The Pearson correlation of r = -0.40 indicates a moderate negative association, but the explained variance is modest: R² = 0.161, meaning only about 16.1% of the variance in total trade count is attributable to S&P 500 opening price. The remaining ~84% is driven by other factors entirely. The 95% confidence interval of [-0.50, -0.29] is entirely negative and reasonably tight, confirming the direction of the relationship with reasonable precision. The p-value of 4.18×10⁻¹¹ is highly statistically significant given N = 3,750, making it extremely unlikely this correlation arose by chance. However, the Granger causality analysis provides an important caveat: neither direction (X→Y at p = 0.073, Y→X at p = 0.338) reaches conventional significance thresholds, meaning neither variable reliably predicts the other's future values. The relationship is contemporaneous rather than temporally predictive — correlation without directional forecasting power.
Patterns, Clusters, and Outliers The sample points reveal meaningful structural features. The X-axis spans a wide range (~586K to ~2.28M in the underlying scaling), with data clustering more densely in the 1.4M–1.9M range, corresponding to mid-to-late 2012 as the S&P 500 advanced. Trade counts (Y) are concentrated between roughly 1,280 and 1,460, with several notable outliers: points near (1,604,277, 1,280.93) and (1,577,340, 1,277.03) sit distinctly below the main cluster, suggesting specific sessions with unusually low trade activity regardless of price level. Conversely, (2,036,237, 1,460.07) and (1,703,519, 1,441.60) represent high-price, high-trade-count sessions that partially contradict the negative trend, indicating the relationship is far from deterministic. There is also visible heteroscedasticity — variance in trade counts appears broader at moderate price levels and compresses at extremes.
Confounding Factors and Caveats Several important caveats apply. First, temporal autocorrelation is almost certain in daily financial data — both S&P 500 prices and trade volumes follow trending or mean-reverting patterns across 2012, so what appears as a price-volume correlation may largely reflect shared time trends (e.g., both variables drifting as the year progressed and market conditions evolved). Second, the dataset covers only one calendar year (2012), a period of generally rising equity prices following the 2011 volatility, limiting generalizability. Third, market microstructure changes — such as algorithmic trading shifts, regulatory events, or exchange-specific volume migrations — could drive trade count changes independently of price levels. Finally, the axes appear to represent two distinct datasets joined by date, meaning the correlation is calendar-aligned rather than mechanistically linked, increasing the risk of spurious association driven by shared seasonality or macroeconomic conditions.
Actionable Insights and Further Investigation Practitioners should be cautious about inferring any causal mechanism from this correlation, given the failed Granger causality tests and the modest R². For further investigation, it would be valuable to: (1) partial out the time trend by regressing both variables on a date index and examining the residual correlation; (2) disaggregate trade count by exchange (Cboe vs. TRFs vs. other venues) to identify whether the negative relationship is driven by a specific market segment; (3) extend the time window across multiple years to test whether the negative relationship holds in bear markets or higher-volatility regimes; and (4) incorporate volatility measures (e.g., VIX) as a mediating variable, since volatility independently drives both trading activity and price movements. The finding that higher S&P prices correlate with lower trade counts may reflect a broader narrative of declining retail participation and algorithmic consolidation in 2012, worth exploring with volume-by-participant-type data.
X dataset: Cboe U.S. Equities Historical Market Volume Data 2012
Y dataset: S&P 500 Daily Time Series since 1927 (GitHub fja05680) (Date)
Part of experiment: Daily - Cboe U.S. Equities Historical Market Volume Data 2012 vs S&P 500 Daily Time Series since 1927 (GitHub fja05680) (Date)