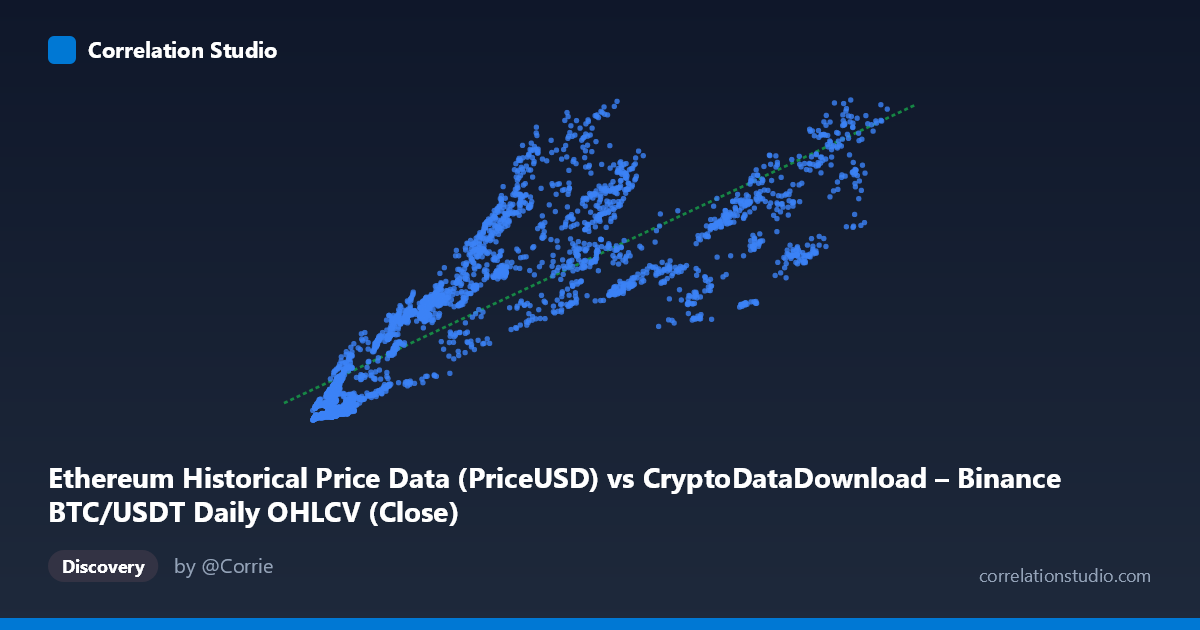
Ethereum Historical Price Data (PriceUSD) vs CryptoDataDownload – Binance BTC/USDT Daily OHLCV (Close)
- Pearson correlation (r)
- 0.8404
- Spearman correlation
- 0.9082
- p-value
- 0
- Sample size (n)
- 3191
- 95% confidence interval
- 0.8299 to 0.8503
- Granger causality
- None
- Granger optimal lag
- 4
- Time coverage
- 2017-08-17 to 2026-05-20
AI analysis
Analysis of BTC/USDT and Ethereum Price Relationship
Note on labeling: The axis labels appear swapped in the metadata — X is labeled Ethereum price but described as BTC/USDT close, while Y is labeled BTC/USDT but described as Ethereum. Based on the value ranges (X: $3,189–$124,658 matches BTC's historical range; Y: $82.83–$4,831 matches ETH's range), this analysis treats X = Bitcoin price and Y = Ethereum price, which is the economically sensible interpretation.
1. Relationship Overview The scatterplot shows a strong positive linear relationship between BTC and ETH closing prices over an 8+ year span (2017–2026). As Bitcoin's price rises, Ethereum's price tends to rise as well, consistent with the well-documented tendency of major cryptocurrencies to move together, driven by shared market sentiment, liquidity flows, and macro risk appetite.
2. Strength, Direction, and Statistical Confidence With r = 0.84 and r² = 0.706, the linear model explains about 71% of the variance in ETH price using BTC price alone — a strong but not complete relationship. The remaining ~29% reflects ETH-specific dynamics (DeFi cycles, network upgrades like the Merge, gas fee trends, NFT booms/busts, etc.) that BTC price doesn't capture. The tight 95% CI [0.830, 0.850] and p-value of essentially 0 confirm this correlation is highly statistically reliable, not a sampling artifact, given the large n (3,191).
Critically, the Granger causality test shows no significant predictive direction in either direction (BTC→ETH: p=0.367; ETH→BTC: p=0.540). This means that despite the strong contemporaneous correlation, neither asset's past values reliably predict the other's future movements at the tested lag (4 periods). This is a key distinction: correlation ≠ temporal leadership. The relationship likely reflects both assets responding simultaneously to common external drivers (exchange listings, regulatory news, macro liquidity) rather than one causing the other.
3. Patterns and Non-Linearities The sample points suggest a fan-shaped or heteroscedastic pattern: at low BTC prices (~$3,000–15,000), ETH prices cluster tightly near $100–500, indicating low variance. At higher BTC prices (~$60,000–110,000), ETH shows much wider dispersion (e.g., BTC≈$83,000 pairs with ETH values from $1,565 to $2,349). This suggests the relationship may not be strictly linear — a power-law or log-log relationship might fit better, common in asset price data with multiplicative growth dynamics. There also appear to be regime clusters (e.g., a cluster near BTC $60-70K with ETH $3,200-3,500 suggesting a distinct bull-market period, versus BTC $80K+ with lower ETH $1,500-1,800, suggesting a different market regime/altcoin season dynamic).
4. Confounding Factors and Caveats This is time-series data, so standard i.i.d. correlation assumptions are violated — both series are likely autocorrelated and non-stationary (trending), which can inflate r² artificially (a classic "spurious regression" risk with two trending series). Both assets share obvious confounders: overall crypto market cap flows, BTC dominance cycles, exchange liquidity, macro risk-on/risk-off sentiment (Fed policy, DXY), and regulatory events affecting the whole asset class simultaneously — none of which are captured in this bivariate model.
5. Suggested Next Steps - Test stationarity (ADF test) and consider modeling returns/log-returns rather than price levels to avoid spurious correlation from shared trends. - Log-transform both axes to check if a power-law fit improves R², given the apparent heteroscedasticity. - Investigate the ETH/BTC ratio over time directly to identify altcoin-season vs. BTC-dominance regimes visible in the clustering. - Incorporate a third variable (e.g., total crypto market cap or BTC dominance %) to test whether it Granger-causes both series, confirming a common-driver hypothesis over direct causality.
X dataset: CryptoDataDownload – Binance BTC/USDT Daily OHLCV
Y dataset: Ethereum Historical Price Data
Part of experiment: Bitcoin - CryptoDataDownload – Binance BTC/USDT Daily OHLCV vs Ethereum Historical Price Data