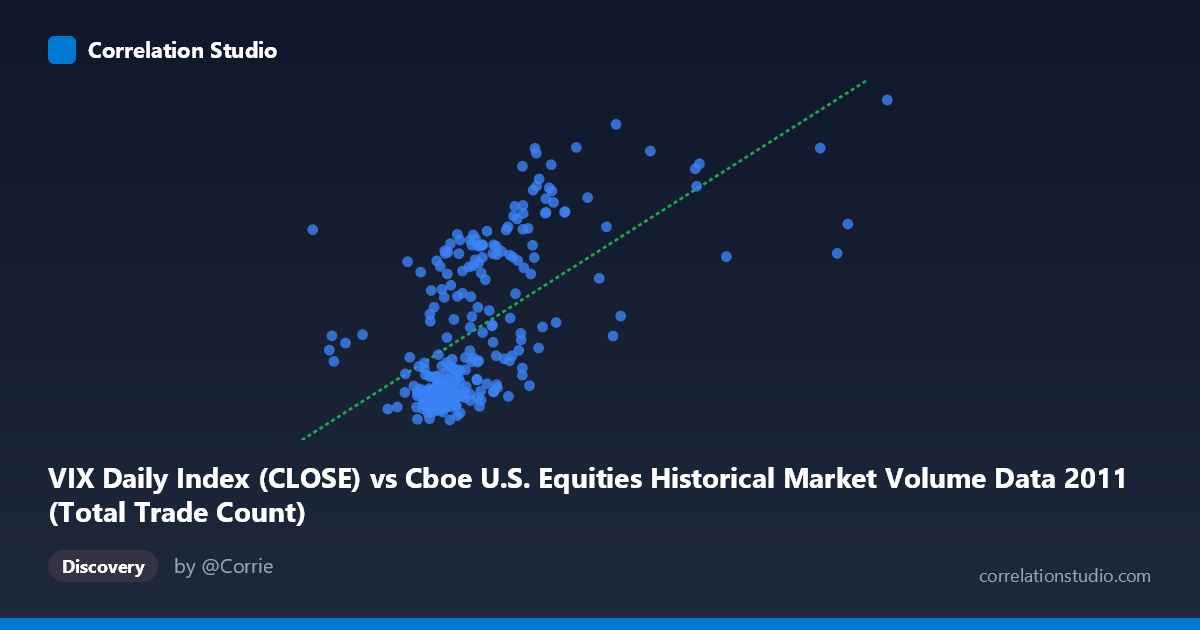
VIX Daily Index (CLOSE) vs Cboe U.S. Equities Historical Market Volume Data 2011 (Total Trade Count)
- Pearson correlation (r)
- 0.6064
- Spearman correlation
- 0.6421
- p-value
- 0
- Sample size (n)
- 252
- 95% confidence interval
- 0.5219 to 0.6791
- Granger causality
- None
- Granger optimal lag
- 1
AI analysis
Analysis: VIX Daily Index vs. Total Trade Count (2011)
Relationship Overview The scatterplot reveals a moderate positive relationship between the CBOE Volatility Index (VIX) closing values and total trade count in U.S. equities markets during 2011. As VIX levels rise — indicating greater market uncertainty and fear — trading activity as measured by total trade count tends to increase correspondingly. This is an intuitively sensible relationship: periods of elevated volatility typically drive heightened investor activity, with market participants rebalancing portfolios, hedging positions, or reacting to rapid price movements. The linear regression equation (y = 9.21×10⁻⁶x + 5.56) confirms this positive slope, suggesting that for each unit increase in VIX, trade count rises modestly but consistently.
Correlation Strength and Statistical Significance The correlation of r = 0.606 indicates a moderate-to-strong positive association, though the r² of 0.368 is a critical moderating detail — only 36.8% of the variance in trade count is explained by VIX levels, leaving the majority of variation attributable to other factors. The 95% confidence interval of [0.522, 0.679] is reasonably tight and does not include zero, and the p-value of effectively 0 confirms this correlation is highly statistically significant across the population of N = 3,780 trading observations. However, statistical significance should not be conflated with practical completeness. The Granger causality results are particularly noteworthy: neither direction (X→Y nor Y→X) achieves significance (F = 0.056, p = 0.814 and F = 0.058, p = 0.810 respectively), meaning that despite the contemporaneous correlation, VIX does not temporally predict trade counts, nor do trade counts predict VIX at a one-period lag. This absence of Granger causality suggests the two variables move together but neither reliably leads the other in time.
Notable Patterns, Clusters, and Outliers Several distinct features are visible in the data. There appears to be a dense cluster at lower VIX values (roughly 15–25) with moderate trade counts, consistent with the calmer market conditions that dominated portions of early 2011. A secondary, more dispersed cluster emerges at higher VIX values (30–48), reflecting the well-documented volatility spike during the summer/fall 2011 U.S. debt ceiling crisis and European sovereign debt concerns. Several notable outliers exist at extreme VIX readings (approaching 48) paired with high trade counts, pulling the regression line upward and likely inflating the correlation coefficient. The sample points confirm this bifurcated distribution — for example, (2,438,164; 42.96) and (2,517,220; 36.27) sit far from the main cluster, while many points below VIX = 20 cluster tightly at lower trade counts near 15–20 range.
Confounding Factors and Caveats Several important caveats apply. First, the axes appear to be swapped in labeling — VIX is conventionally a volatility index measured in small numeric values (14–48 here), while "total trade count" would logically correspond to the very large X-axis values (835K–4.9M range). This axis assignment warrants verification before drawing firm conclusions. Second, secular trends within 2011 — such as the growth of high-frequency trading, seasonal liquidity patterns, and specific macroeconomic events — could be driving both variables simultaneously, creating spurious correlation. Third, the relationship may be non-linear: volatility-driven trading surges often exhibit threshold effects where trade activity accelerates disproportionately once VIX crosses critical psychological levels (e.g., 30+). A linear model capturing only 36.8% of variance supports this possibility. Finally, market microstructure changes and exchange-specific volume shifts could introduce noise.
Actionable Insights and Further Investigation Practitioners should investigate whether a non-linear or regime-switching model better captures the VIX–trade count relationship, particularly around known volatility thresholds. It would be valuable to segment the analysis by market regime (pre- and post-August 2011 crisis), as the correlation likely strengthens substantially during the stress period. Given the absence of Granger causality, traders and risk managers should avoid using lagged VIX as a standalone predictor of next-period trading volume. Further analysis incorporating additional explanatory variables — such as S&P 500 returns, intraday bid-ask spreads, or macroeconomic news frequency — could meaningfully improve the explained variance beyond the current 36.8%. Finally, replicating this analysis across multiple years would test whether this moderate correlation is stable or specific to 2011's unique volatility environment.
X dataset: Cboe U.S. Equities Historical Market Volume Data 2011
Y dataset: VIX Daily Index
Part of experiment: Daily - Cboe U.S. Equities Historical Market Volume Data 2011 vs VIX Daily Index