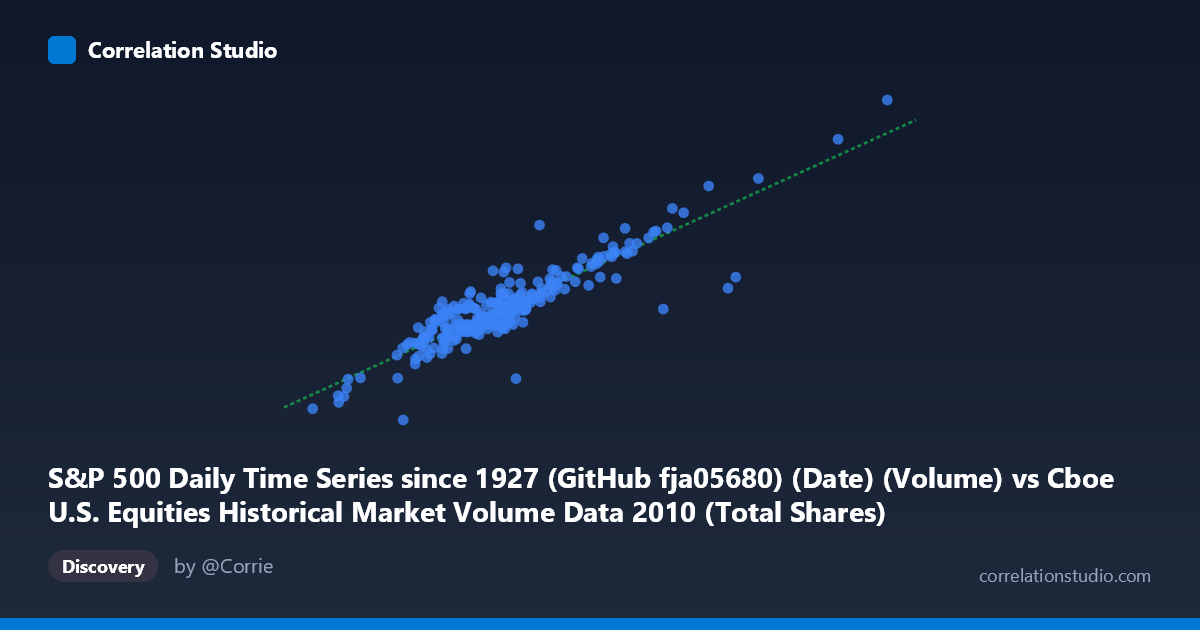
S&P 500 Daily Time Series since 1927 (GitHub fja05680) (Date) (Volume) vs Cboe U.S. Equities Historical Market Volume Data 2010 (Total Shares)
- Pearson correlation (r)
- 0.9007
- Spearman correlation
- 0.853
- p-value
- 0
- Sample size (n)
- 252
- 95% confidence interval
- 0.8745 to 0.9217
- Granger causality
- None
- Granger optimal lag
- 10
AI analysis
Analysis: S&P 500 Daily Volume vs. Cboe U.S. Equities Total Shares (2010)
Relationship Overview The scatterplot reveals a strong, positive linear relationship between S&P 500 daily trading volume and Cboe U.S. equities total shares traded across 252 trading days in 2010. As S&P 500 volume increases, total Cboe shares traded rise correspondingly in a fairly tight, upward-sloping band. The linear regression equation (y = 5.407x + 1.016×10⁹) suggests that for every additional unit of S&P 500 volume, total Cboe shares increase by approximately 5.4 units, with a substantial baseline intercept reflecting the broader market context beyond just S&P 500 constituents. This relationship is visually coherent — the data points cluster closely around the regression line across most of the observed range, reinforcing the impression of a robust, systematic co-movement between these two measures of market activity.
Correlation Strength and Statistical Significance With r = 0.9007 and r² = 0.8113, approximately 81.1% of the variance in total Cboe shares traded is explained by S&P 500 volume alone — a remarkably high proportion for financial market data. The 95% confidence interval [0.8745, 0.9217] is narrow and does not approach zero, indicating the estimate is stable and precise. The p-value of effectively zero confirms that this correlation is astronomically unlikely to arise by chance given a paired sample of n = 252 drawn from a population of N = 3,302. However, the Granger causality results introduce an important nuance: neither direction (X→Y: F = 1.68, p = 0.088; Y→X: F = 1.29, p = 0.236) reaches conventional significance thresholds at the optimal 10-period lag. This means that while the two series move together strongly in a contemporaneous sense, neither series demonstrably predicts the other temporally — the co-movement appears synchronous rather than directionally driven, suggesting a common underlying driver rather than a causal chain between them.
Patterns, Clusters, and Outliers The bulk of observations cluster between roughly 400–800 million on the X-axis and 3–6 billion on the Y-axis, forming a dense central core consistent with typical 2010 trading conditions. There is a notable upper-right outlier cluster at X ≈ 1.48 billion (Y ≈ 9.47 billion) and another elevated point near X ≈ 1.23 billion (Y ≈ 5.45 billion) — the latter appearing to deviate meaningfully below the regression line, suggesting that on that day, S&P 500 volume was unusually elevated relative to total Cboe activity, or vice versa. One point at approximately (410M, 1.29B) sits conspicuously below the cluster, representing an anomalously low total shares day that may correspond to a holiday-adjacent or low-liquidity session. A moderate degree of heteroscedasticity appears present — variance in Y seems to widen slightly at higher X values — which could modestly violate linear regression assumptions and slightly inflate confidence in the fit.
Confounding Factors and Caveats The high r² should be interpreted cautiously, as both variables are fundamentally measuring the same underlying phenomenon — U.S. equity market trading activity — from two overlapping but distinct vantage points. This means the correlation may be partially tautological: days with high overall market activity will naturally produce high readings on both measures simultaneously. The datasets originate from different sources (GitHub/Yahoo Finance vs. Cboe), and any differences in reporting methodology, settlement timing, exchange coverage, or trade-type inclusion (e.g., dark pool trades, TRF-routed volume) could introduce systematic divergence. The absence of Granger causality at a 10-period lag also suggests that any apparent "lead-lag" trading strategy built on this relationship would likely fail. Seasonality, macro events (e.g., Flash Crash aftershocks in 2010), and month-end rebalancing flows could all act as latent confounders driving simultaneous spikes in both series.
Actionable Insights and Further Investigation The 81% explained variance and near-zero p-value confirm these two volume measures can serve as reliable proxies for one another in 2010 data, which has practical value for data imputation or cross-validation between datasets. However, the unexplained ~19% variance is where the most analytically interesting signal likely resides — investigators should examine residuals to identify which specific dates show the largest divergences, then test whether those deviations correspond to identifiable market events (e.g., options expiration, Fed announcements, or ETF rebalancing). Given the lack of Granger causality, further work should focus on identifying the common driver — likely overall investor sentiment or volatility regime (VIX) — using a multivariate framework. Expanding the time window beyond 2010 to test whether this relationship holds across different volatility regimes (e.g., 2008, 2020) would substantially strengthen or qualify the generalizability of these findings.
X dataset: Cboe U.S. Equities Historical Market Volume Data 2010
Y dataset: S&P 500 Daily Time Series since 1927 (GitHub fja05680) (Date)
Part of experiment: Daily - Cboe U.S. Equities Historical Market Volume Data 2010 vs S&P 500 Daily Time Series since 1927 (GitHub fja05680) (Date)