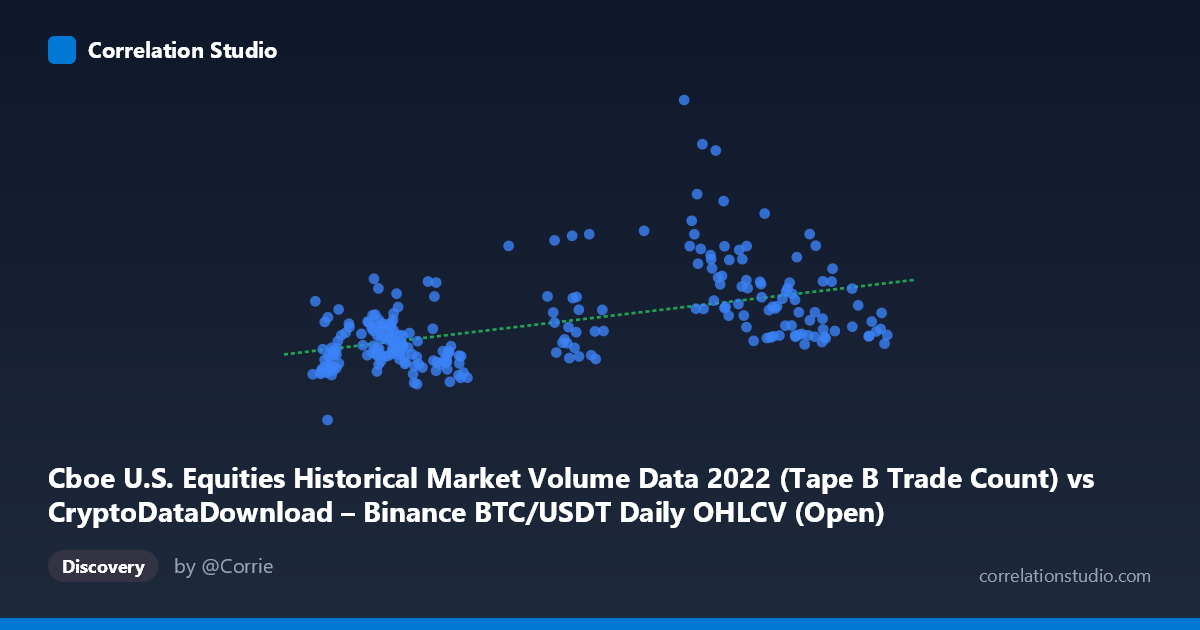
Cboe U.S. Equities Historical Market Volume Data 2022 (Tape B Trade Count) vs CryptoDataDownload – Binance BTC/USDT Daily OHLCV (Open)
- Pearson correlation (r)
- 0.5061
- Spearman correlation
- 0.5004
- p-value
- 0
- Sample size (n)
- 251
- 95% confidence interval
- 0.4079 to 0.5928
- Granger causality
- None
- Granger optimal lag
- 10
AI analysis
Analysis of the Scatterplot Relationship
Note on variable labeling: The axis labels appear to be swapped/mismatched in the metadata (X is described as Cboe trade counts, Y as Binance Open price), but the actual data ranges (X: ~15,781–47,435; Y: ~169,559–1,407,746) suggest X is more likely a trade-count-like metric and Y likely reflects a volume/notional figure. For this analysis, I'll treat them simply as X and Y per the numeric data provided.
1. Overall Relationship
The scatterplot shows a positive but moderate association between X and Y. As X increases from roughly 16,000 to 47,000, Y tends to increase as well, moving from a baseline around 350,000–500,000 up toward values that occasionally spike above 900,000–1,400,000. However, the relationship is far from tight or deterministic — there is substantial vertical scatter at almost every X value, indicating that X alone is a weak-to-moderate predictor of Y.
2. Strength, Direction, and Statistical Confidence
The correlation coefficient r = 0.506 indicates a moderate positive linear relationship. Critically, r² = 0.256 tells us that only about 25.6% of the variance in Y is explained by X — meaning nearly three-quarters of Y's variability is driven by other factors entirely. The 95% CI [0.408, 0.593] is reasonably tight and does not cross zero, and the p-value ≈ 0 confirms this correlation is highly statistically significant and not due to chance, despite its modest strength. However, statistical significance here reflects sample size (n=251) more than practical predictive power.
Importantly, the Granger causality tests show no significant predictive direction in either direction (X→Y: p=0.36; Y→X: p=0.48). This means that past values of X do not help forecast future Y beyond what Y's own history provides, and vice versa. The correlation is contemporaneous, not causal or lead-lag in nature — the two series move together at the same time but don't meaningfully forecast each other over time.
3. Notable Patterns and Outliers
Several observations stand out: - A cluster of low-X, low-Y points (X ≈ 15,000–24,000, Y ≈ 340,000–560,000) forms a dense baseline cloud with relatively tight, consistent behavior. - A distinct set of high-Y outliers appears at mid-range X values (~29,000–41,000) where Y spikes dramatically to 860,000–1,400,000 (e.g., the point at X=37,988, Y=1,212,395). These look like volatility/volume spikes decoupled from the typical linear trend. - The relationship appears heteroscedastic: variance in Y increases substantially as X grows, fanning out rather than maintaining constant spread — suggesting the linear model underserves the upper X range. - No clear non-linear curvature (e.g., logarithmic or exponential shape) dominates, but the spike cluster suggests occasional regime shifts or event-driven jumps in Y independent of X.
4. Confounding Factors and Caveats
Because this pairs crypto trading data (BTC/USDT) with U.S. equities market volume (Cboe), any correlation is likely driven by shared macro conditions — e.g., overall 2022 market volatility, risk-on/risk-off sentiment, Fed policy announcements, or liquidity crunches that simultaneously affected both crypto and equity markets, rather than a direct mechanical link between the two. The mismatched axis descriptions in the metadata also raise concern about data integrity/alignment; results should be verified against correctly labeled source columns before drawing market conclusions. Additionally, daily data over one year (2022) captures a single, atypical market regime (crypto bear market, rate hikes) — findings may not generalize to other periods.
5. Suggested Next Steps
- Verify variable identities with the data source to ensure X and Y are correctly mapped before publishing conclusions. - Investigate the high-Y outlier cluster (spikes near X=29,000–41,000) — check if these align with specific calendar events (e.g., FOMC meetings, crypto exchange collapses like FTX in Nov 2022) that could explain co-movement without direct causality. - Given r² of only 25%, look for additional explanatory variables (e.g., VIX, crypto volatility index, macro liquidity measures) to build a more predictive multivariate model. - Since Granger tests show no lead-lag relationship, avoid using one series to forecast the other; instead, treat correlation as coincidental/environmental rather than predictive. - Consider testing on higher-frequency (intraday) data or different lag structures, as daily granularity and the tested lag (10 periods) may mask shorter-term dynamic relationships.
X dataset: CryptoDataDownload – Binance BTC/USDT Daily OHLCV
Y dataset: Cboe U.S. Equities Historical Market Volume Data 2022
Part of experiment: Bitcoin - CryptoDataDownload – Binance BTC/USDT Daily OHLCV vs Cboe U.S. Equities Historical Market Volume Data 2022