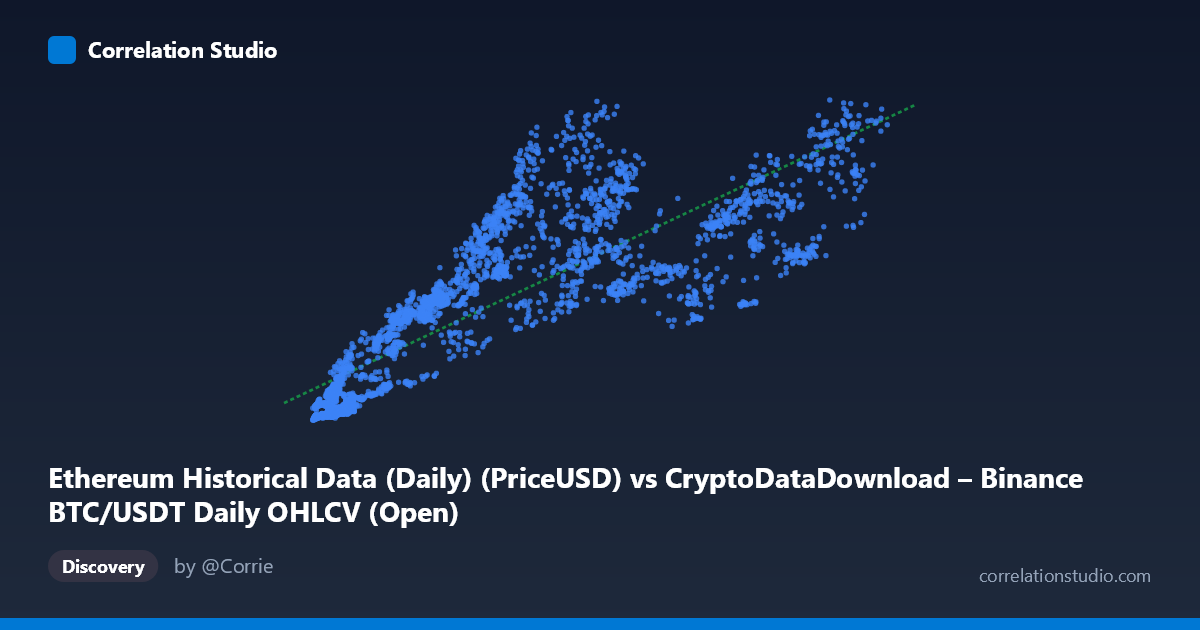
Ethereum Historical Data (Daily) (PriceUSD) vs CryptoDataDownload – Binance BTC/USDT Daily OHLCV (Open)
- Pearson correlation (r)
- 0.8401
- Spearman correlation
- 0.908
- p-value
- 0
- Sample size (n)
- 3191
- 95% confidence interval
- 0.8296 to 0.8501
- Granger causality
- None
- Granger optimal lag
- 4
AI analysis
Analysis: BTC/USDT Price vs. Ethereum Open Price
1. Relationship Overview
The scatterplot shows a strong positive association between Bitcoin price (X) and Ethereum's opening price (Y) across 3,191 daily observations spanning nearly nine years (2017–2026). As BTC prices rise from roughly $3,000 to $124,000, ETH prices tend to climb in tandem from under $100 to over $4,800. The relationship appears broadly linear with a fitted slope of ~0.033, meaning each $1 increase in BTC price is associated with roughly 3.3 cents of increase in ETH price — though the data also show visible curvature and dispersion consistent with two correlated but distinct assets moving through shared market cycles rather than a strict mechanical relationship.
2. Strength, Direction, and Uncertainty
The correlation coefficient (r = 0.840) indicates a strong positive linear relationship, with r² = 0.706 meaning about 70.6% of the variance in ETH's price is statistically explained by BTC's price — a substantial but incomplete linkage, leaving nearly 30% of ETH's price variation driven by other factors. The 95% confidence interval [0.830, 0.850] is tight, and the p-value of ~0 confirms this correlation is highly statistically significant and not due to chance, given the large sample size. However, the Granger causality tests reveal no significant predictive direction in either direction (BTC→ETH: p=0.366; ETH→BTC: p=0.547) at the optimal lag of 4 periods. This is a critical distinction: strong contemporaneous correlation does not imply that past values of one asset help forecast future values of the other — the two prices likely move together due to shared external drivers (market sentiment, liquidity cycles, macro conditions) rather than one causing the other with a lagged effect.
3. Patterns, Clusters, and Outliers
The sample points suggest clustering around several price regimes: a low-price cluster (BTC $3,000–$12,000, ETH $80–$450) corresponding to earlier market cycles, a mid-range cluster (BTC $20,000–$60,000, ETH $1,300–$2,600), and a high-price cluster (BTC $80,000–$125,000, ETH $1,500–$4,800). Notably, dispersion increases at higher BTC prices — at BTC ~$80,000, ETH values range widely from ~$1,565 to ~$2,349, indicating heteroscedasticity (non-constant variance) and suggesting the relationship weakens or becomes noisier at higher valuations, possibly due to ETH-specific dynamics (e.g., protocol upgrades, DeFi/NFT cycles) decoupling it from pure BTC-driven momentum during certain periods.
4. Confounding Factors and Caveats
This correlation is likely driven by common macro confounders rather than a direct causal mechanism: overall crypto market sentiment, Bitcoin dominance cycles, regulatory news, institutional capital flows, and macroeconomic liquidity (interest rates, dollar strength) tend to move all major cryptocurrencies simultaneously. Both series are also non-stationary time series with strong trends, which can inflate correlation coefficients artificially (spurious correlation risk) even after appropriate testing — the Granger results support caution here, since no lagged predictive power exists despite the high r. Additionally, the "N=3,212 vs n=3,191" discrepancy suggests some missing/misaligned data points, and daily OHLCV data can be affected by exchange-specific quirks, low-liquidity periods, or flash volatility events that don't reflect broader market conditions.
5. Actionable Insights
Given the lack of Granger causality, this relationship should not be used for lead-lag trading strategies (e.g., using BTC moves to predict next-day ETH moves) — instead, treat BTC and ETH as contemporaneously co-moving assets, useful for portfolio correlation/diversification analysis rather than forecasting. For deeper insight, consider: (a) testing cointegration (e.g., Johansen test) to check for a long-run equilibrium relationship despite lack of Granger causality, (b) analyzing the ETH/BTC ratio directly to study relative strength cycles, (c) segmenting the analysis by market regime (bull/bear/sideways) to see if r² varies, and (d) incorporating a third variable (e.g., total crypto market cap or BTC dominance) to test whether both assets are jointly driven by a common latent factor rather than each other.
X dataset: CryptoDataDownload – Binance BTC/USDT Daily OHLCV
Y dataset: Ethereum Historical Data (Daily)
Part of experiment: Bitcoin - CryptoDataDownload – Binance BTC/USDT Daily OHLCV vs Ethereum Historical Data (Daily)