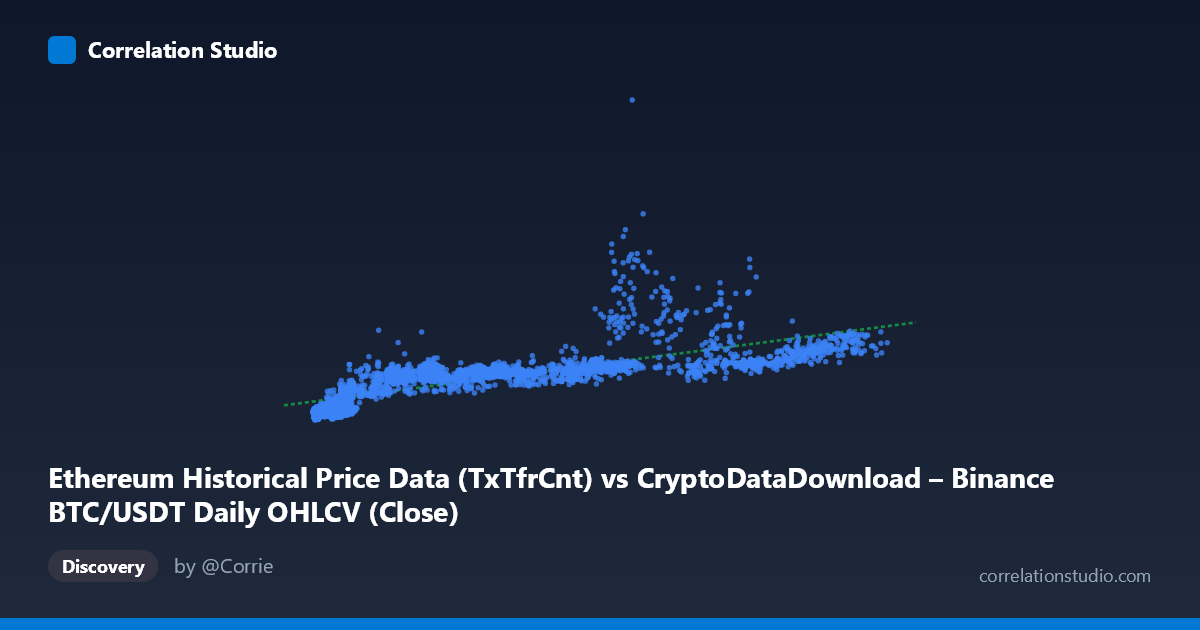
Ethereum Historical Price Data (TxTfrCnt) vs CryptoDataDownload – Binance BTC/USDT Daily OHLCV (Close)
- Pearson correlation (r)
- 0.7555
- Spearman correlation
- 0.9036
- p-value
- 0
- Sample size (n)
- 3191
- 95% confidence interval
- 0.7403 to 0.7701
- Granger causality
- None
- Granger optimal lag
- 10
AI analysis
Analysis of the Relationship Between X and Y Variables
1. What the Visualization Reveals
The scatterplot shows a positive, moderately strong relationship between the two variables (labeled here as X and Y, though the metadata suggests some column-naming confusion between the BTC/USDT and Ethereum datasets). As X increases, Y tends to increase as well, though the relationship shows meaningful scatter rather than a tight linear band. The data appears to fan out—variance in Y grows as X increases—suggesting heteroscedasticity rather than a uniform linear trend across the full range.
2. Strength, Direction, and Statistical Confidence
The Pearson correlation (r = 0.7555) indicates a moderately strong positive relationship, with r² = 0.5708 meaning roughly 57% of the variance in Y is explained by X (or the linear model), leaving 43% unexplained—attributable to other factors, noise, or nonlinear dynamics not captured by this simple model. The 95% confidence interval [0.740, 0.770] is narrow, and the p-value of ~0 confirms this correlation is highly statistically significant and not a product of chance, aided by the large sample size (n = 3,191).
However, the Granger causality tests reveal no significant predictive direction in either direction (X→Y: p = 0.545; Y→X: p = 0.624). This is an important caveat: despite the strong contemporaneous correlation, neither variable helps forecast the other's future values at the tested lag structure (optimal lag = 10 periods). This suggests the co-movement is likely driven by a shared external factor (e.g., overall crypto market sentiment, macro liquidity conditions) rather than one variable causing or leading the other.
3. Notable Patterns and Non-linear Features
Examining the sample points, several patterns emerge: - Clustering at low X values (roughly X < 15,000) with Y values spanning widely from ~200,000 to ~950,000, suggesting high variance in Y even when X is compressed near its minimum. - A few outliers/high-leverage points stand out, such as (66,901.99, 2,698,591) and (81,447.01, 1,847,022), where Y is disproportionately high relative to the surrounding cluster—these could reflect specific volatile periods (e.g., market rallies or crashes). - The note that Spearman ρ exceeds Pearson r is significant—it indicates the rank-order relationship is stronger than the linear relationship, reinforcing that a logarithmic or power-law curve may fit the data better than a straight line. This is common in financial/crypto data where growth is multiplicative rather than additive.
4. Confounding Factors and Caveats
Several caveats apply: - Dataset labeling inconsistency: the metadata shows both axes referencing BTC/USDT and Ethereum data interchangeably, which raises questions about whether this is truly a cross-asset comparison or a mislabeled single-asset analysis. This should be verified before drawing conclusions. - Non-stationarity: crypto price/volume data is typically non-stationary (trending, volatile), which can inflate correlation coefficients spuriously even when no causal link exists—this is a classic issue in time-series correlation analysis. - Common external drivers: both series may be jointly driven by overall crypto market cycles, Bitcoin dominance effects, regulatory news, or macroeconomic liquidity—rather than one metric mechanically influencing the other. - Heteroscedasticity (increasing variance at higher X) violates a core linear regression assumption, meaning standard errors and the r² value may be less reliable at the extremes of the range.
5. Actionable Insights and Further Investigation
Given the Spearman/Pearson divergence, refitting with a log-log or polynomial model is a natural next step, which may substantially improve explained variance beyond 57%. Additionally, since Granger causality was insignificant, analysts should avoid using one series to forecast the other in a trading or predictive context—instead, consider first-differencing or returns-based analysis (rather than levels) to test for causality more robustly, since raw price/volume levels often obscure short-term causal dynamics. Finally, clarifying the actual data source/column mapping is essential before publishing conclusions, and investigating the identified outliers (e.g., the 2,698,591 Y-value point) may reveal specific market events worth isolating from the broader trend analysis.
X dataset: CryptoDataDownload – Binance BTC/USDT Daily OHLCV
Y dataset: Ethereum Historical Price Data
Part of experiment: Bitcoin - CryptoDataDownload – Binance BTC/USDT Daily OHLCV vs Ethereum Historical Price Data