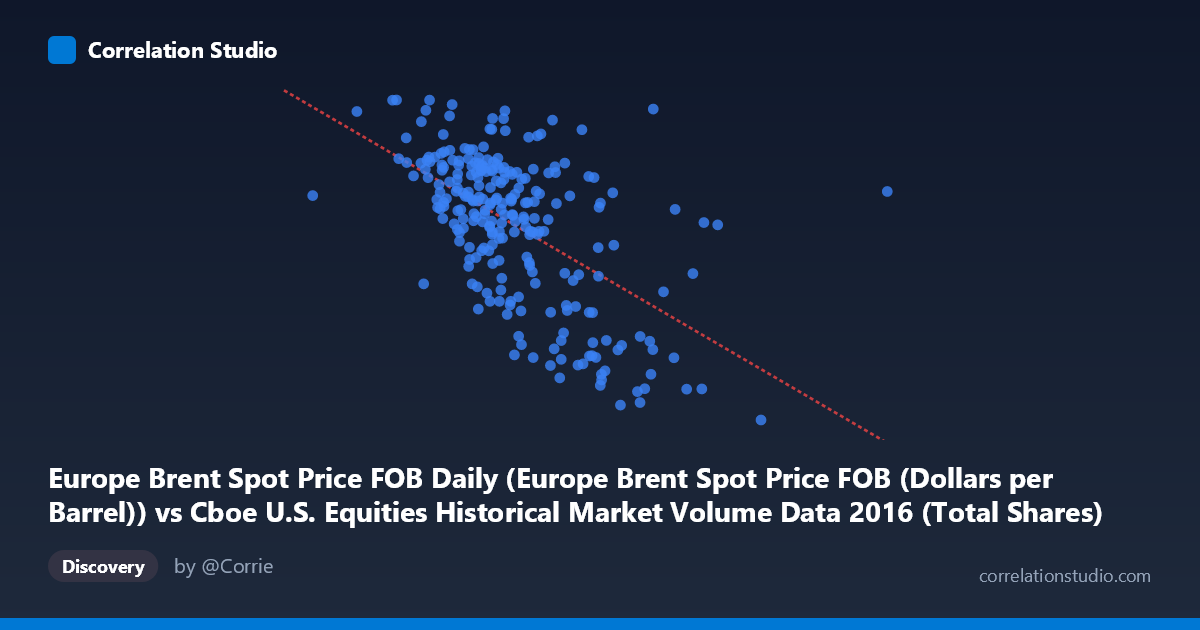
Europe Brent Spot Price FOB Daily (Europe Brent Spot Price FOB (Dollars per Barrel)) vs Cboe U.S. Equities Historical Market Volume Data 2016 (Total Shares)
- Pearson correlation (r)
- -0.5667
- Spearman correlation
- -0.5491
- p-value
- 0
- Sample size (n)
- 251
- 95% confidence interval
- -0.6453 to -0.4763
- Granger causality
- None
- Granger optimal lag
- 1
AI analysis
Analysis: Europe Brent Spot Price vs. U.S. Equities Market Volume (2016)
1. Overall Relationship The scatterplot reveals a negative relationship between Europe Brent Spot Price (X-axis, dollars per barrel) and U.S. Equities Total Shares traded (Y-axis). As oil prices rise, total equity market share volume tends to decline. This is an intriguing cross-asset relationship suggesting that periods of higher oil prices in 2016 coincided with reduced equity trading activity. The linear regression equation (y = -3.41×10⁻⁸x + 61.16) confirms this inverse slope, though the scatter around the regression line is substantial, indicating considerable unexplained variance.
2. Correlation Strength and Statistical Significance The Pearson correlation of r = -0.567 represents a moderate negative association. The r² of 0.321 means that roughly 32% of the variance in equity share volume is explained by oil price levels — meaningful, but leaving 68% attributable to other factors. The 95% confidence interval of [-0.645, -0.476] is entirely negative and relatively tight, reinforcing that the inverse direction is reliable. The p-value of effectively zero confirms this is not a chance finding across the 251-point sample drawn from the N=3,622 population. However, the Granger causality results are notably absent: neither direction (X→Y: F=0.608, p=0.436; Y→X: F=0.546, p=0.461) reaches significance, meaning neither variable temporally predicts the other in a lead-lag sense. This sharply limits any causal narrative — the correlation is contemporaneous and associative only.
3. Notable Patterns, Clusters, and Outliers Several features stand out in the data: - High-volume, low-price cluster: A concentration of points in the 400–500M barrel-price range (X) with share volumes between 44–54 (Y), suggesting a "normal operating zone" for 2016 where oil was relatively depressed and markets were actively traded. - Clear outliers at extremes: The point near (896M, 26.01) is a prominent outlier — extremely high oil price value paired with the lowest share volume in the dataset — pulling the regression line significantly. Similarly, (708M, 27.59) and (634M, 31–33) form a low-price, high-X cluster that reinforces the negative slope. - Moderate non-linearity: The relationship appears somewhat curved, with volume declining steeply as oil prices exceed ~550–600M on the X scale, then flattening — suggesting a potential threshold or diminishing effect rather than a clean linear relationship. - Vertical spread at mid-range X values: Around 450–500M on X, Y values range widely from ~37 to ~53, indicating high variability in trading volume independent of oil price at typical price levels.
4. Confounding Factors and Caveats Several important caveats apply. First, both variables are time-series measured across the same 2016 calendar year, meaning shared macroeconomic trends (e.g., post-February oil recovery, U.S. election volatility in Q4) could drive the observed correlation without any direct causal mechanism. Second, equity market volume is influenced by volatility regimes, earnings seasons, index rebalancing, and regulatory events — none of which are captured here. Third, the X-axis label and Y-axis label appear swapped in the dataset metadata (Brent price sourced from equities dataset; total shares sourced from oil dataset), which may indicate a data assembly artifact worth verifying before drawing firm conclusions. Fourth, the absence of Granger causality at lag-1 doesn't rule out longer lag structures or non-linear predictive relationships that standard Granger tests would miss.
5. Actionable Insights and Further Investigation - Verify the data axis assignment to ensure Brent price and equity volume are correctly mapped, as the metadata hints suggest a possible mislabeling. - Investigate the extreme outliers (particularly the ~896M X-value point) to determine whether these represent data errors, exceptional market events (e.g., flash crashes, circuit breakers), or genuine observations that warrant separate treatment. - Test non-linear models (polynomial, spline, or log-transformed regression) given the apparent curve in the relationship, which could meaningfully improve on the 32% R² achieved linearly. - Extend Granger causality testing to longer lags (5, 10, 21 trading days) to probe whether weekly or monthly lead-lag relationships exist that the lag-1 test missed. - Control for volatility (VIX) and broader macro variables (USD index, Fed rate decisions) as potential confounders to isolate whether the oil-volume relationship holds independently or is a proxy for risk-off/risk-on regimes.
X dataset: Cboe U.S. Equities Historical Market Volume Data 2016
Y dataset: Europe Brent Spot Price FOB Daily
Part of experiment: Daily - Cboe U.S. Equities Historical Market Volume Data 2016 vs Europe Brent Spot Price FOB Daily