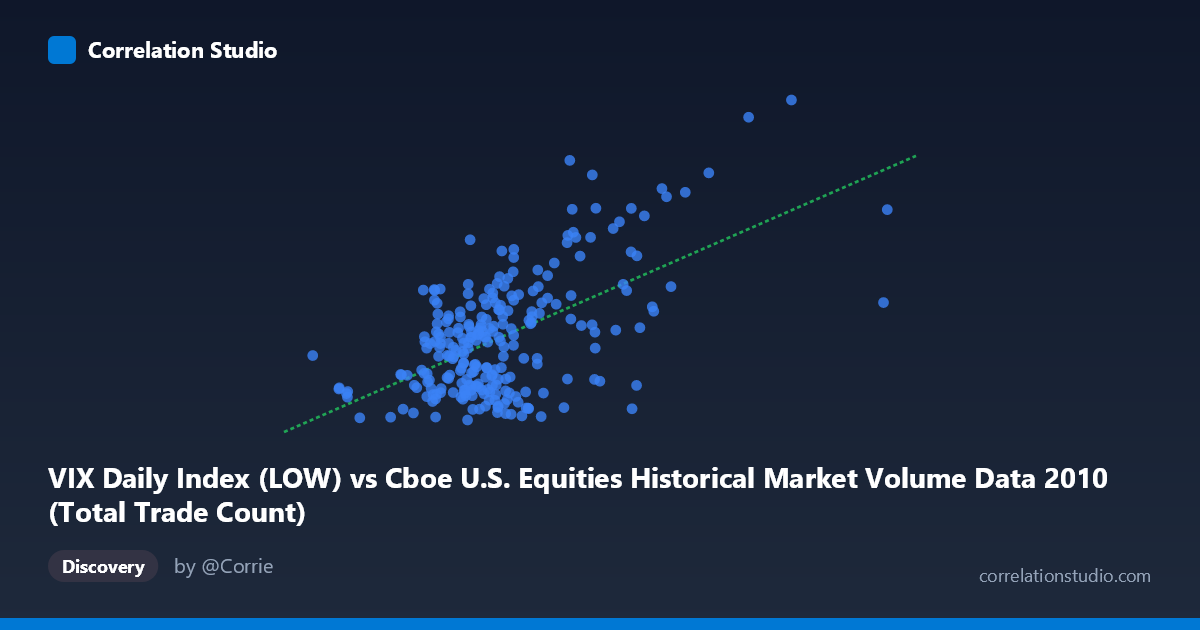
VIX Daily Index (LOW) vs Cboe U.S. Equities Historical Market Volume Data 2010 (Total Trade Count)
- Pearson correlation (r)
- 0.5763
- Spearman correlation
- 0.4167
- p-value
- 0
- Sample size (n)
- 252
- 95% confidence interval
- 0.4874 to 0.6533
- Granger causality
- Y → X
- Granger optimal lag
- 1
AI analysis
Analysis: VIX Daily Index (LOW) vs. Total Trade Count
Relationship Overview
The scatterplot reveals a moderate positive relationship between the VIX Daily Index Low values and the Total Trade Count in U.S. equities markets during 2010. As the VIX low reading increases, total trade counts tend to rise as well, which is intuitively sensible: periods of elevated volatility typically generate heightened market activity as participants react to uncertainty through increased buying, selling, and hedging. The linear regression equation (y = 4.04207E-06x + 12.6504) confirms this positive slope, though the wide dispersion around the regression line is immediately apparent, suggesting that VIX alone is far from a complete explanation of trading volume behavior.
Correlation Strength and Statistical Significance
The correlation coefficient of r = 0.5763 indicates a moderate positive association, but the r² of 0.3321 is the more sobering figure — VIX Low values explain only about 33.2% of the variance in Total Trade Count, leaving roughly two-thirds of variation attributable to other factors. The 95% confidence interval for r [0.4874, 0.6533] is reasonably tight given n = 252 paired observations, and the p-value of effectively zero confirms this relationship is not a statistical artifact. However, statistical significance here is partly a function of the large population size (N = 3,302), so practical significance deserves independent scrutiny. Critically, the Granger causality results point in one direction: Y (VIX) Granger-causes X (Trade Count) with F = 6.6564 and p = 0.0105, while the reverse direction (X→Y) fails to reach significance (F = 2.3214, p = 0.1289). This suggests that past VIX readings carry predictive information about future trade counts, but not vice versa — a meaningful asymmetry with practical trading implications.
Notable Patterns, Clusters, and Outliers
The data exhibits several visually distinct features. A dense cluster of observations congregates in the lower-left region (VIX Low roughly 648K–2.5M, Trade Count 15–25), reflecting the relatively calm, high-volume baseline trading environment that characterized much of 2010's recovery period. However, several prominent outliers populate the upper-right quadrant — most notably the point near (5,514,533, 31.71) and the cluster around (4,340,243, 38.95) and (4,002,972, 34.59) — suggesting episodic spikes where both VIX and trade counts surged simultaneously, likely corresponding to specific market stress events such as the May 2010 Flash Crash. There also appear to be points with high VIX readings but relatively modest trade counts (e.g., ~2,825,615 with 35.57), hinting at non-linear dynamics or regime-specific behavior that a simple linear model cannot fully capture.
Confounding Factors and Caveats
Several important caveats temper interpretation. First, the axes appear to be swapped in dataset attribution — VIX data is labeled as the X-axis source from a "Market Volume" dataset, and trade counts are labeled from a "VIX" dataset, suggesting a possible metadata inversion that should be verified before drawing firm conclusions. Second, seasonality in both VIX and trading activity (e.g., lower summer volumes, year-end effects) could be driving portions of the observed correlation without any direct causal mechanism. Third, the 2010 period is unusual given post-financial crisis dynamics and the Flash Crash, making generalization to other time periods risky. Fourth, the Granger causality finding at only a 1-period lag may be sensitive to the specific lag structure chosen, and Granger causality does not imply true economic causation — both variables could be jointly driven by macroeconomic news flow or institutional order flow patterns.
Actionable Insights and Further Investigation
The Granger causality finding — that VIX leads trade count — is perhaps the most actionable result here. Market makers, exchanges, and algorithmic traders could potentially use VIX levels as a short-horizon signal for anticipated order flow, staffing capacity planning, or dynamic spread adjustment. For further investigation, analysts should: (1) decompose the relationship by market regime (pre/post Flash Crash) to test structural stability; (2) incorporate additional predictors such as S&P 500 returns, bid-ask spreads, or news sentiment to improve on the 33.2% variance explained; (3) test non-linear specifications (e.g., threshold regression or quantile regression) given the apparent curvature and heteroscedasticity in the upper tail; and (4) verify the dataset column attribution to ensure the directional conclusions of the Granger analysis are correctly oriented. A VAR or GARCH-based model incorporating both variables simultaneously would likely yield richer insights into their dynamic interaction.
X dataset: Cboe U.S. Equities Historical Market Volume Data 2010
Y dataset: VIX Daily Index
Part of experiment: Daily - Cboe U.S. Equities Historical Market Volume Data 2010 vs VIX Daily Index