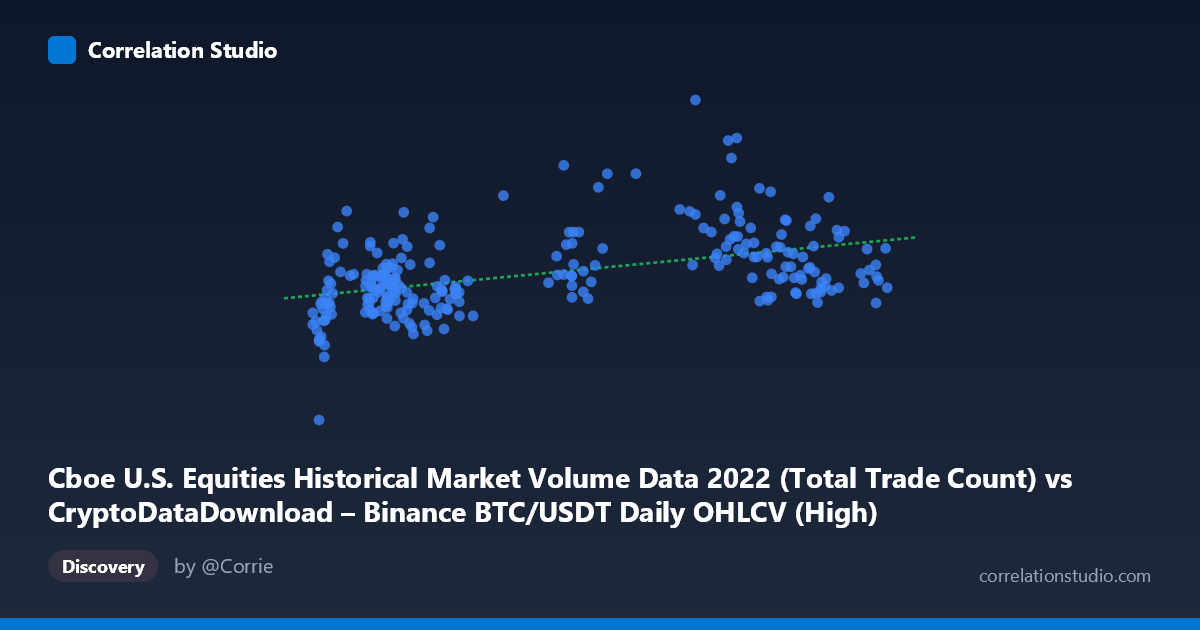
Cboe U.S. Equities Historical Market Volume Data 2022 (Total Trade Count) vs CryptoDataDownload – Binance BTC/USDT Daily OHLCV (High)
- Pearson correlation (r)
- 0.4576
- Spearman correlation
- 0.4664
- p-value
- 0
- Sample size (n)
- 251
- 95% confidence interval
- 0.3539 to 0.5503
- Granger causality
- None
- Granger optimal lag
- 10
- Time coverage
- 2022-01-03 to 2022-12-30
AI analysis
Analysis: Cboe Equities Trade Count vs. Binance BTC/USDT High Price (2022)
1. What the Visualization Reveals
The scatterplot shows a modest positive association between U.S. equities trade counts (X) and Bitcoin's daily high price (Y) throughout 2022. Points form a loose, upward-sloping cloud rather than a tight linear band, with substantial vertical scatter at nearly every X value — indicating that while the variables move together to some degree, X is far from a reliable predictor of Y on any given day.
2. Strength, Direction, and Uncertainty
The correlation coefficient (r = 0.4576) indicates a weak-to-moderate positive relationship. Critically, r² = 0.2094 means only about 21% of the variance in BTC's daily high is statistically associated with equities trade count — leaving nearly 80% of the variation unexplained by this single variable. The 95% CI [0.354, 0.550] is reasonably tight and excludes zero, and the p-value (2.13E-14) confirms the correlation is highly statistically significant — but statistical significance here reflects the reasonably large sample (n=251), not practical predictive strength. Most importantly, the Granger causality tests show no significant temporal predictability in either direction (X→Y: p=0.62; Y→X: p=0.245). This is a key finding: even though the series are correlated contemporaneously, past values of one do not help forecast future values of the other. This strongly suggests the relationship is either coincidental, driven by a shared external factor, or purely contemporaneous rather than causal/predictive.
3. Notable Patterns and Outliers
The data shows two loosely defined clusters: a dense group at lower X values (~16,000–25,000 trade counts) with Y ranging widely from ~3.2M to ~5.1M, and a sparser group at higher X values (~37,000–48,000) where Y also spans widely (~3.7M to ~6.4M). Several notable outliers stand out — e.g., (30243, 5,965,975) and (39362, 6,397,686) sit well above the main trend, while (16315, 3,188,314) anchors the lower-left extreme. These high-Y outliers at moderate X suggest episodic spikes in BTC price unrelated to proportional increases in equities trading activity, possibly tied to crypto-specific news events (e.g., FTX collapse, Fed announcements) rather than equity market volume shifts.
4. Confounding Factors and Caveats
Several caveats limit causal interpretation: - Spurious correlation risk: Both series are time-ordered financial data from 2022, a year marked by synchronized macro stress (Fed rate hikes, inflation, risk-off sentiment) that could drive both equities activity and BTC prices independently, without direct linkage. - Non-stationarity: Both series likely trended (BTC fell sharply over 2022; equity volumes fluctuated with volatility events), which can inflate correlation between two independently trending series. - Different market drivers: Equities trade count reflects retail/institutional equity activity, while BTC high price reflects crypto-specific supply/demand, regulatory news, and liquidity — mechanistically distinct markets. - Sampling: n=251 of N=3,212 (roughly 1-in-13 subsampling) may not fully capture intraday or clustering dynamics.
5. Actionable Insights
Given the weak r², non-significant Granger causality, and likely confounding from shared macro conditions, this pair should not be used as a standalone trading or forecasting signal. Recommended next steps: - Test for cointegration (e.g., Engle-Granger) given probable trends in both series, rather than relying on simple correlation. - Control for a common macro factor (e.g., VIX, Fed policy dates, or overall market risk sentiment) via multivariate regression to see if the correlation persists or vanishes. - Explore whether the relationship is stronger during high-volatility regimes (e.g., during 2022 crypto crash events) rather than assuming stationarity across the full year. - Consider detrending or differencing both series before re-testing correlation/causality to rule out trend-driven spurious association.
X dataset: CryptoDataDownload – Binance BTC/USDT Daily OHLCV
Y dataset: Cboe U.S. Equities Historical Market Volume Data 2022
Part of experiment: Bitcoin - CryptoDataDownload – Binance BTC/USDT Daily OHLCV vs Cboe U.S. Equities Historical Market Volume Data 2022