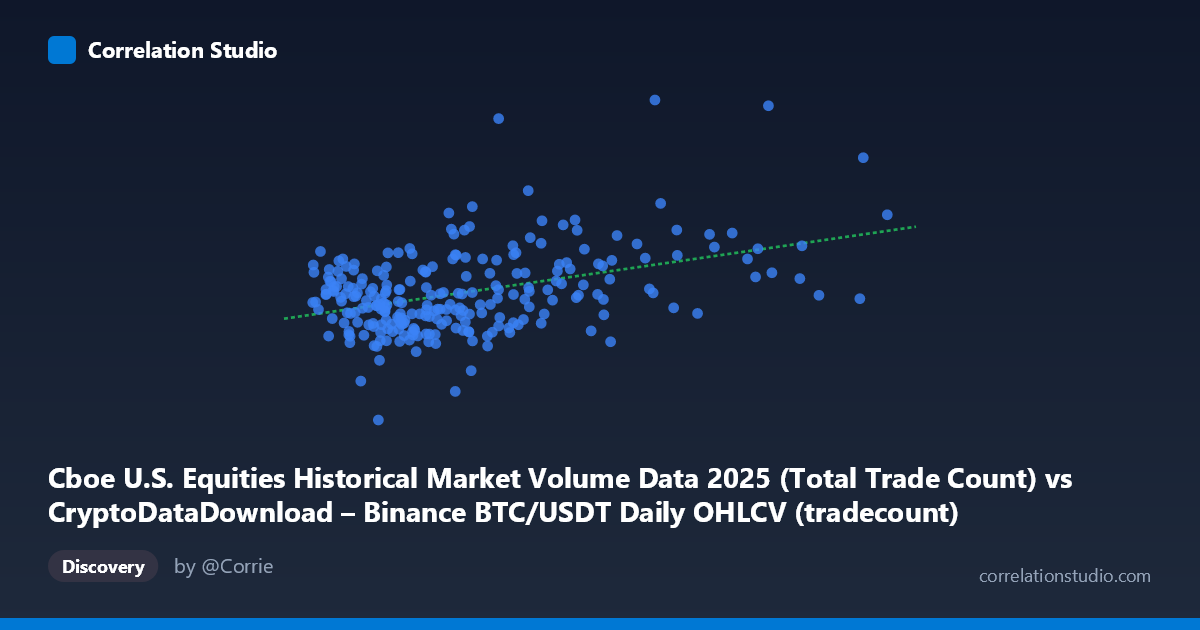
Cboe U.S. Equities Historical Market Volume Data 2025 (Total Trade Count) vs CryptoDataDownload – Binance BTC/USDT Daily OHLCV (tradecount)
- Pearson correlation (r)
- 0.415
- Spearman correlation
- 0.2897
- p-value
- 0
- Sample size (n)
- 250
- 95% confidence interval
- 0.3068 to 0.5127
- Granger causality
- None
- Granger optimal lag
- 10
AI analysis
Analysis: Cboe Equities Trade Count vs. Binance BTC/USDT Trade Count
1. Overall Relationship
The scatterplot shows a weak-to-moderate positive relationship between the two variables. Most data points cluster tightly in the lower-left region of the plot (X roughly 2M–7M, Y roughly 4.5M–7M), with a sparse scattering of higher-X outliers (up to ~11.8M) trailing off to the right. The bulk of the data forms a loose, diffuse cloud rather than a tight linear band, indicating that while there is some co-movement, the relationship is far from deterministic.
2. Strength, Direction, and Statistical Confidence
The correlation coefficient (r = 0.415) indicates a weak-to-moderate positive linear relationship. Critically, r² = 0.172 means only about 17% of the variance in Cboe trade counts is explained by Binance trade counts (or vice versa) — the remaining 83% is driven by other factors entirely outside this bivariate relationship. That said, with n = 250 and a 95% CI of [0.307, 0.513] excluding zero, plus an extremely small p-value (7.9E-12), we can be confident this correlation is statistically real and not due to chance — it's just modest in practical magnitude. Importantly, the Granger causality tests show no significant predictive direction in either direction (p = 0.95 for X→Y, p = 0.65 for Y→X). This means neither series reliably helps forecast future values of the other over time; the correlation is likely contemporaneous/coincidental rather than causal or lead-lag in nature.
3. Patterns, Clusters, and Outliers
The data reveals a dense cluster of points where both trade counts are relatively low-to-moderate (X < 7M, Y between 4.5M–7M), suggesting this is the "typical" daily regime for both markets. A handful of points with unusually high X values (6.6M–11.8M) — including one extreme outlier near X ≈ 11.8M — appear to pull the regression slope upward but don't show a correspondingly extreme Y value, suggesting these may be high-volume Binance trading days unrelated to unusual Cboe activity. There's no obvious non-linear curvature (e.g., no clear exponential or logarithmic bend), and no distinct sub-clusters suggesting regime-switching behavior.
4. Confounding Factors and Caveats
Several caveats limit causal interpretation: - Spurious correlation from shared macro trends: Both crypto and equity trading volumes can rise/fall together during periods of general market volatility, risk-on/risk-off sentiment, or macroeconomic news — without one directly driving the other. - Temporal aggregation mismatch: Comparing daily Binance data to daily Cboe data assumes aligned trading calendars, but crypto trades 24/7 while equities have fixed sessions — this can introduce noise. - Third variables: VIX-like volatility spikes, major news events, algorithmic trading correlations, or even calendar effects (month-end, quarter-end rebalancing) could independently inflate both trade counts simultaneously. - Small effect size: With r² of only 17%, any regression-based prediction (y = 0.195x + 4.79M) has limited practical forecasting power on its own.
5. Suggestions for Further Investigation
Given the lack of Granger causality, this relationship is best treated as contemporaneous co-variation, not a predictive signal. To deepen the analysis: (1) test for common external drivers (e.g., overall market volatility indices, macro news calendars) that might explain simultaneous volume spikes in both markets; (2) examine whether the relationship strengthens during high-volatility periods (e.g., segment data by volatility regime); (3) investigate the high-X outliers individually to see if they correspond to specific crypto market events (halvings, exchange outages, etc.); and (4) consider a lagged cross-correlation analysis with finer time resolution (hourly) rather than daily, since the 24/7 nature of crypto trading may create hidden lead-lag dynamics that daily aggregation obscures.
X dataset: CryptoDataDownload – Binance BTC/USDT Daily OHLCV
Y dataset: Cboe U.S. Equities Historical Market Volume Data 2025
Part of experiment: Bitcoin - CryptoDataDownload – Binance BTC/USDT Daily OHLCV vs Cboe U.S. Equities Historical Market Volume Data 2025