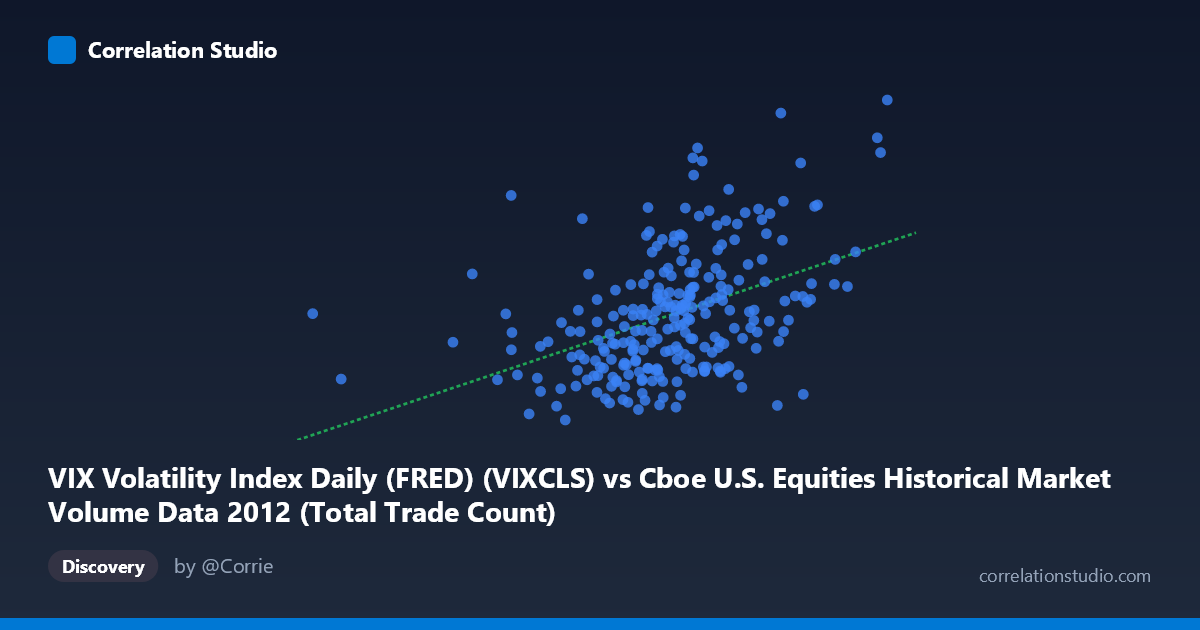
VIX Volatility Index Daily (FRED) (VIXCLS) vs Cboe U.S. Equities Historical Market Volume Data 2012 (Total Trade Count)
- Pearson correlation (r)
- 0.4374
- Spearman correlation
- 0.459
- p-value
- 0
- Sample size (n)
- 250
- 95% confidence interval
- 0.3314 to 0.5326
- Granger causality
- None
- Granger optimal lag
- 1
AI analysis
Analysis: VIX Volatility Index vs. Total Trade Count (2012)
Relationship Overview
The scatterplot reveals a moderate positive relationship between the VIX Volatility Index and total U.S. equity trade counts during 2012. As the VIX rises — signaling greater implied volatility and market fear — trading activity tends to increase, which aligns intuitively with market microstructure theory: uncertainty drives investors and traders to rebalance, hedge, or exit positions, thereby generating more transactions. The linear regression equation (y = 4.68E-06x + 10.09) confirms this positive slope, though the relationship is clearly noisy, with substantial scatter around the trend line at nearly every VIX level.
Correlation Strength and Statistical Significance
The Pearson correlation of r = 0.4374 indicates a moderate positive association, but the coefficient of determination tells a more sobering story: r² = 0.1914, meaning VIX explains only about 19% of the variance in total trade count. The remaining ~81% is driven by other factors entirely. Despite this modest explanatory power, the result is highly statistically significant (p = 4.15E-13, N = 3,750), so the relationship is almost certainly real and not a sampling artifact. The 95% confidence interval for r of [0.33, 0.53] is reasonably tight, confirming reliable estimation. However, the Granger causality tests are both non-significant (X→Y: F = 0.17, p = 0.68; Y→X: F = 0.22, p = 0.64), meaning neither variable reliably predicts the other's future values at a one-period lag. This critically undermines any causal narrative: VIX and trade volume may move together contemporaneously without either leading the other in a temporally predictive sense.
Notable Patterns, Clusters, and Outliers
Several structural features stand out in the sample data. The bulk of observations cluster in the VIX range of roughly 1.4M–2.0M with trade counts between 14 and 20, forming a dense core. However, there is a visible upper-right cluster of high-VIX, high-trade-count points (e.g., VIX ~23–26 paired with trade counts of 20–24+), which disproportionately drive the positive slope. Conversely, some apparent outliers exist — notably the point near X = 586,357 (far left of the X range) suggesting a possible data anomaly or extreme low-volume day, and points like (2,036,237; 14.51) where very high trade counts coincide with a relatively low VIX, contradicting the trend. These outliers and the high dispersion at mid-range X values suggest the relationship is heteroscedastic, potentially weakening ordinary least squares assumptions.
Confounding Factors and Caveats
Several confounds complicate interpretation. First, day-of-week and seasonal effects systematically influence both VIX levels and trading volumes independent of any causal link. Second, macroeconomic events in 2012 (European sovereign debt crisis, U.S. fiscal cliff concerns, Fed QE3 announcement) created episodic spikes in both variables simultaneously, potentially inflating the correlation through shared external shocks rather than a direct mechanism. Third, the dataset axis labels appear swapped in the metadata — the X-axis column is listed under a VIX dataset while the Y-axis column is listed under the volume dataset, which warrants verification before drawing firm conclusions. Finally, the single-year window (2012) limits generalizability; the relationship may differ substantially in low-volatility regimes like 2017 or crisis periods like 2008–2009.
Actionable Insights and Further Investigation
Practitioners should be cautious about using VIX as a standalone predictor of trade volume given that it explains less than one-fifth of variance and shows no Granger-causal relationship. Recommended next steps include: (1) extending the analysis across multiple years to test regime dependency; (2) incorporating additional predictors (bid-ask spreads, news sentiment, options open interest) to build a more complete model of trade count; (3) applying rolling-window correlation analysis to test whether the VIX–volume relationship strengthens specifically during high-volatility episodes; and (4) testing non-linear models (e.g., log-log or piecewise regression), since the relationship may intensify above VIX thresholds of ~20, as suggested by the upper-right cluster. Resolving the apparent metadata label discrepancy should be the immediate first step before any production use of these findings.
X dataset: Cboe U.S. Equities Historical Market Volume Data 2012
Y dataset: VIX Volatility Index Daily (FRED)
Part of experiment: Daily - Cboe U.S. Equities Historical Market Volume Data 2012 vs VIX Volatility Index Daily (FRED)