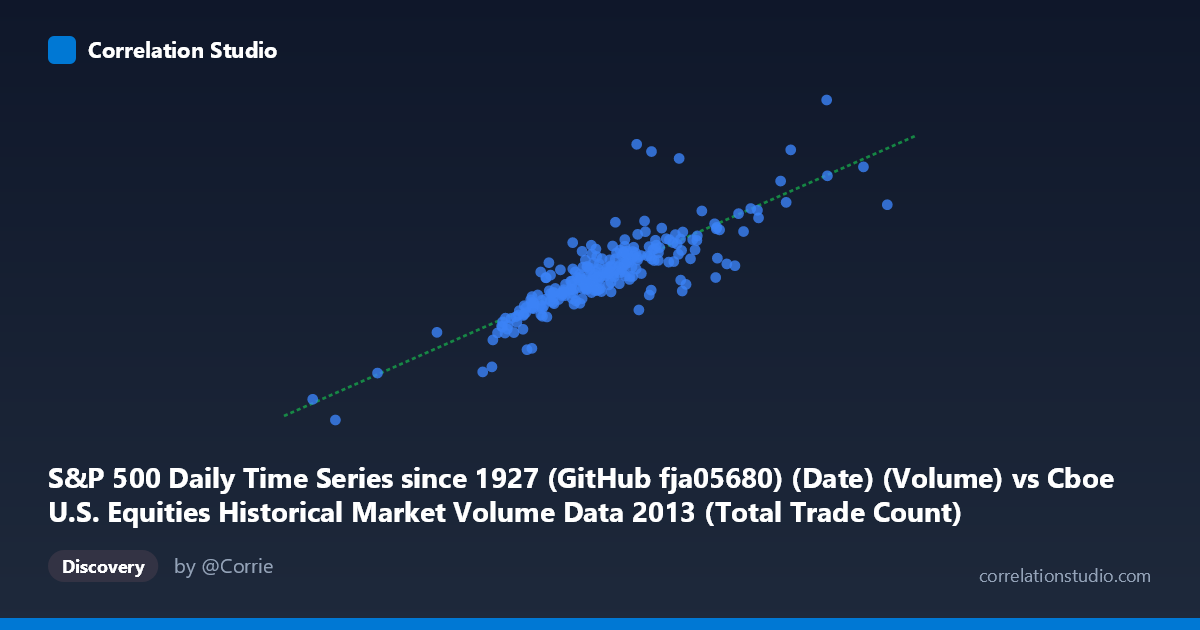
S&P 500 Daily Time Series since 1927 (GitHub fja05680) (Date) (Volume) vs Cboe U.S. Equities Historical Market Volume Data 2013 (Total Trade Count)
- Pearson correlation (r)
- 0.8492
- Spearman correlation
- 0.8466
- p-value
- 0
- Sample size (n)
- 252
- 95% confidence interval
- 0.8107 to 0.8804
- Granger causality
- None
- Granger optimal lag
- 10
AI analysis
Analysis: S&P 500 Trading Volume vs. Total Trade Count (2013)
Relationship Overview The scatterplot reveals a strong positive linear relationship between S&P 500 daily trading volume and the total trade count across U.S. equities exchanges in 2013. As daily share volume increases, the total number of trades rises correspondingly, which is intuitively sensible — higher market activity days tend to generate both more shares changing hands and more discrete transactions. The linear regression equation (y = 2092.23x + 6.42×10⁷) suggests that for every additional unit of volume, trade count increases by approximately 2,092 transactions, with a substantial baseline intercept reflecting a floor of trading activity even on lower-volume days.
Correlation Strength and Statistical Significance The Pearson correlation of r = 0.8492 indicates a strong positive association, and the coefficient of determination r² = 0.7212 tells us that roughly 72% of the variance in total trade count is explained by trading volume — a meaningful explanatory relationship, though ~28% of variance remains attributable to other factors. The 95% confidence interval of [0.8107, 0.8804] is relatively tight and does not approach zero, and the p-value is effectively 0 (across N = 3,780 population observations with n = 252 paired samples), making this correlation statistically robust with negligible probability of being a chance finding. However, despite this strong contemporaneous correlation, the Granger causality analysis reveals no significant temporal predictive direction in either direction — volume does not significantly predict future trade count (F = 1.17, p = 0.31), nor does trade count predict future volume (F = 0.69, p = 0.73). This is a critical nuance: the two variables move together, but neither reliably leads the other, suggesting they are driven by common underlying forces rather than one causing the other.
Patterns, Clusters, and Outliers The bulk of the data clusters between approximately 1.3M–1.9M in volume and 2.8B–4.0B in trade count, forming a dense central core consistent with typical 2013 trading days. There is a noticeable spread at higher volume levels, with several points extending toward 2.0M–2.4M volume and trade counts approaching or exceeding 4.5–5.8B, suggesting occasional high-activity days (possibly around macro announcements or index rebalancing events). A few points appear as potential outliers — notably, one observation near (1,607,203 volume, 4,081,840,000 trade count) sits notably above the regression line for its volume level, and the point near (899,557 volume, 1,966,050,000 trade count) anchors the lower-left as a low-activity outlier, consistent with a holiday-shortened or summer session. The lower-left region appears relatively sparse, reinforcing that very low-volume days are uncommon in this dataset.
Confounding Factors and Caveats Several important caveats apply. First, both variables are proxies for market activity — they may co-vary largely because they are both driven by the same latent variable (investor participation or market stress), rather than having a direct causal link. Second, market structure changes, such as algorithmic trading behavior, exchange-specific routing decisions, and fragmentation across venues in 2013, could inflate trade counts independently of raw volume. Third, this data covers only one calendar year (2013), a period of relatively low volatility and generally rising markets (post-2012 fiscal cliff resolution), which may limit generalizability to other market regimes. The intercept of ~64.2 million trades even at zero volume hints at structural noise in the data or model misspecification at the extremes. Finally, the Granger test used an optimal lag of 10 periods, and failure to find causality at that lag does not rule out shorter or longer lead-lag dynamics.
Actionable Insights and Further Investigation Practitioners using volume as a real-time market activity signal should note that while it is a strong contemporaneous proxy for trade count, it cannot reliably predict tomorrow's trade count — limiting its value for next-day forecasting. Further investigation should include: (1) decomposing the unexplained 28% variance by incorporating volatility measures (VIX), day-of-week effects, or macro event calendars; (2) testing the relationship across multiple years to assess regime stability, particularly during high-volatility periods (e.g., 2008, 2020); (3) examining whether specific exchanges or TRFs drive the outlier observations; and (4) exploring non-linear models, since the scatter hints at slight heteroscedasticity at higher volume levels — a log-log transformation may yield a tighter fit and more interpretable elasticity coefficient.
X dataset: Cboe U.S. Equities Historical Market Volume Data 2013
Y dataset: S&P 500 Daily Time Series since 1927 (GitHub fja05680) (Date)
Part of experiment: Daily - Cboe U.S. Equities Historical Market Volume Data 2013 vs S&P 500 Daily Time Series since 1927 (GitHub fja05680) (Date)