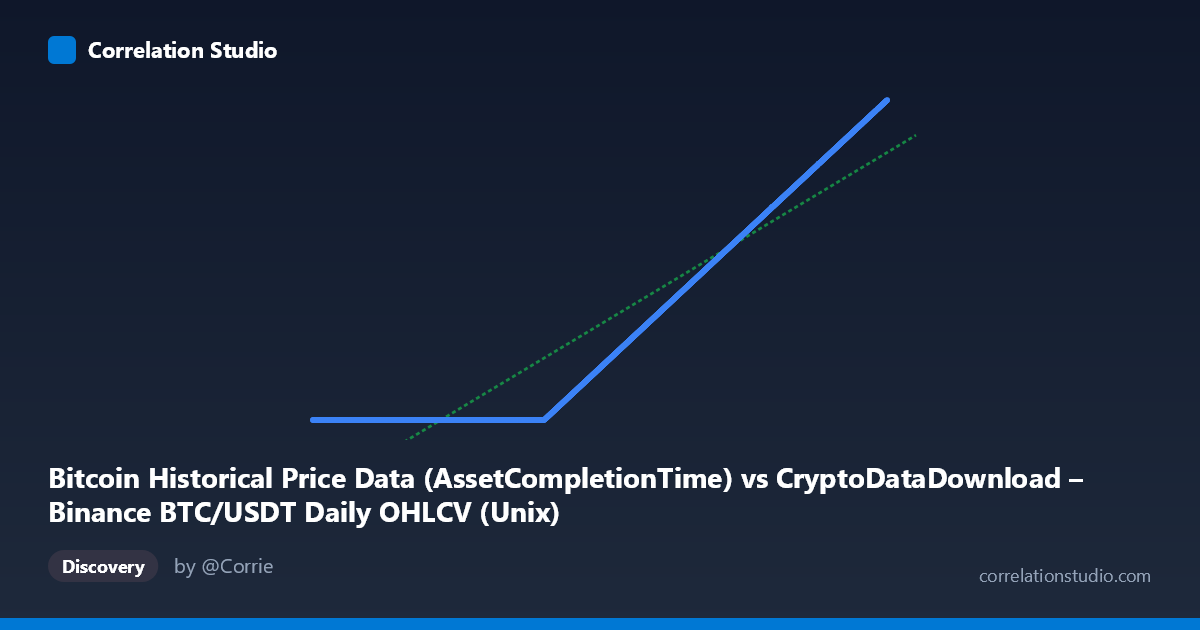
Bitcoin Historical Price Data (AssetCompletionTime) vs CryptoDataDownload – Binance BTC/USDT Daily OHLCV (Unix)
- Pearson correlation (r)
- 0.9386
- Spearman correlation
- 1
- p-value
- 0
- Sample size (n)
- 3191
- 95% confidence interval
- 0.9343 to 0.9426
- Granger causality
- None
- Granger optimal lag
- 10
- Time coverage
- 2017-08-17 to 2026-05-20
AI analysis
Analysis of the Relationship Between X and Y
1. Overview of the Visualization
The scatterplot depicts what should be a nearly 1:1 relationship between two timestamp-like series — a Bitcoin OHLCV "AssetCompletionTime" and a corresponding Unix timestamp column from a separate dataset. At face value, both axes represent time (milliseconds since epoch), so the expected relationship is a perfect diagonal line (y = x). While a strong linear trend is visible, the data reveals a clear data-quality artifact rather than a genuine statistical relationship: a large cluster of points is "stuck" at Y ≈ 1,614,337,xxx regardless of X value, while the remainder of the points track X almost perfectly along the expected diagonal.
2. Correlation Strength and Statistical Interpretation
The reported r = 0.9386 (R² = 0.881) indicates that 88% of the variance in Y is nominally explained by X, with a tight 95% CI [0.934, 0.943] and p ≈ 0 — suggesting overwhelming statistical "significance." However, this is a case where high correlation does not imply a meaningful relationship in the substantive sense: since both variables are timestamps, the correct relationship (excluding the corrupted values) would be r ≈ 1.000, not 0.939. The gap from perfect correlation is entirely attributable to a subset of corrupted/stuck records. The Granger causality results reinforce that there's no genuine predictive temporal dynamic here (F ≈ 0.47–0.56, p 0.84 in both directions) — expected, since time cannot "Granger-cause" itself in a lagged sense; this null result is a sanity check confirming these are not two independently evolving time series but rather duplicate/derived timestamps.
3. Notable Patterns and Anomalies
The dominant anomaly is a horizontal band of Y-values frozen near 1,614,337,xxx (corresponding to ~Feb 2021) across X-values spanning from 2017 through 2021 — visible repeatedly in the sample points (e.g., X = 1503705600000 → Y = 1614337111; X = 1565222400000 → Y = 1614337575). This strongly suggests a data pipeline bug: a null, default, or "last successfully fetched" timestamp was substituted for missing Y values, likely for all records before some ingestion cutoff around February 2021. After that date, X and Y align almost perfectly (e.g., X = 1733616000000 → Y = 1733712385000, differing by only ~86,385 seconds — roughly one day, possibly a timezone/day-boundary offset). This produces a bimodal structure: one degenerate horizontal cluster and one near-perfect diagonal cluster.
4. Confounding Factors and Caveats
The key caveat is that this is not two independent phenomena being correlated — it's likely the same underlying timestamp field duplicated across two datasets, with one copy corrupted for early dates. Any correlation statistic here is measuring data pipeline integrity, not a real-world relationship. The regression equation (slope ≈ 0.00064, intercept ≈ 6.09e8) is heavily distorted by the frozen cluster dragging the fit away from the true y = x line. Treating this as a genuine "X predicts Y" relationship (or computing Granger causality on it) is conceptually questionable, since both columns encode the same clock.
5. Recommended Next Steps
1. Filter and re-run: Exclude records where Y ≈ 1,614,337,xxx (the frozen value) and recompute r, R², and the regression — the true relationship among valid records is almost certainly r ≈ 1.0. 2. Root-cause the freeze: Investigate the ETL/ingestion logic for the "Bitcoin Historical Price Data" dataset to find why records before ~Feb 2021 all default to the same timestamp — likely a missing-data fallback or failed backfill. 3. Check the offset: For valid (non-frozen) pairs, X and Y differ by a roughly constant offset (~1 day) — confirm whether this reflects a timezone conversion, UTC day-boundary rounding, or an indexing bug. 4. Reconsider the Granger test: Since both series are essentially the same clock, causality testing is not meaningful; better used for genuinely distinct metrics (e.g., price vs. network hash rate).
X dataset: CryptoDataDownload – Binance BTC/USDT Daily OHLCV
Y dataset: Bitcoin Historical Price Data
Part of experiment: Bitcoin - CryptoDataDownload – Binance BTC/USDT Daily OHLCV vs Bitcoin Historical Price Data