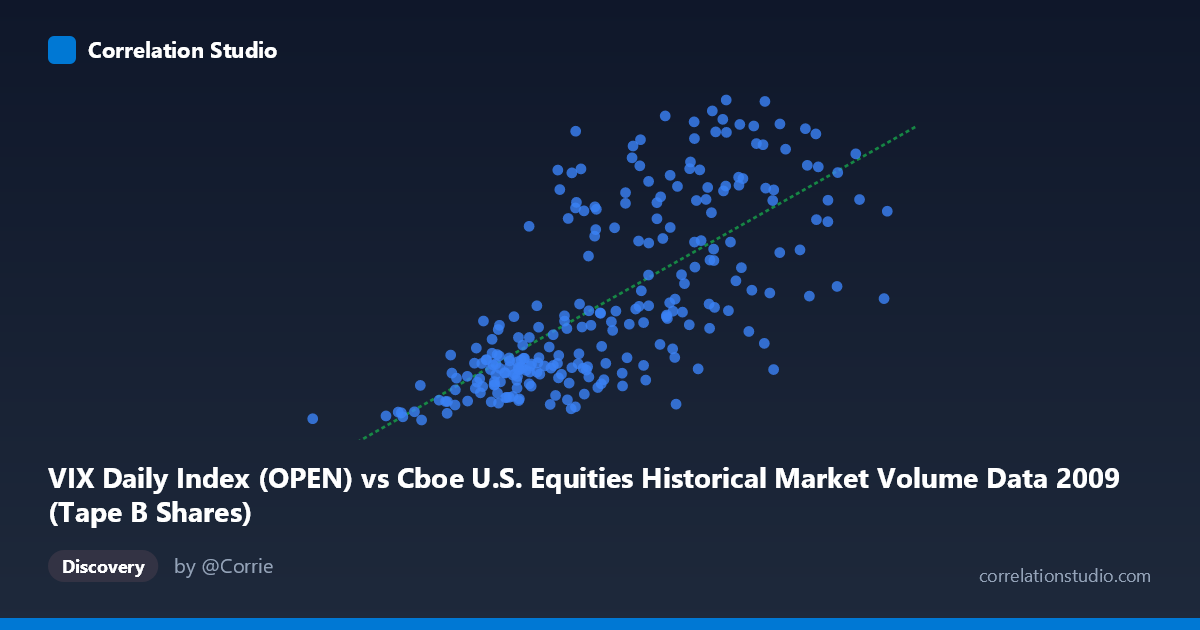
VIX Daily Index (OPEN) vs Cboe U.S. Equities Historical Market Volume Data 2009 (Tape B Shares)
- Pearson correlation (r)
- 0.7039
- Spearman correlation
- 0.746
- p-value
- 0
- Sample size (n)
- 252
- 95% confidence interval
- 0.6357 to 0.7613
- Granger causality
- None
- Granger optimal lag
- 1
AI analysis
Analysis: VIX Daily Index (Open) vs. Tape B Shares — 2009
1. Overall Relationship
The scatterplot reveals a moderately strong positive relationship between the VIX Daily Index open values and Tape B share volume across 2009. As the VIX increases — reflecting higher implied market volatility — Tape B share volume tends to rise in tandem. This is economically intuitive: periods of elevated fear or uncertainty (captured by higher VIX readings) typically drive heightened trading activity as investors reposition, hedge, or react to rapidly changing market conditions. The linear regression equation (y = 1.51314E-07x + 9.525) confirms this upward slope, suggesting that each unit increase in the VIX index value is associated with a measurable increase in Tape B share volume.
2. Correlation Strength, Explained Variance, and Causality
The Pearson correlation of r = 0.704 indicates a moderately strong positive association, but the coefficient of determination (r² = 0.4955) is the more sobering statistic: only ~49.6% of the variance in Tape B shares is explained by the VIX open, meaning roughly half the variation remains attributable to other factors. The 95% confidence interval of [0.636, 0.761] is reasonably tight given the sample size of 252, and the p-value of effectively zero confirms the relationship is statistically significant and not a chance artifact. However, the Granger causality tests tell a critical story: neither direction (X→Y nor Y→X) achieves significance (F = 0.037, p = 0.849 and F = 0.054, p = 0.817, respectively). This means that, at a 1-period lag, neither variable reliably predicts the future values of the other — the correlation is contemporaneous rather than directionally predictive. In practical terms, VIX and Tape B volume tend to move together on the same day but knowing one does not help forecast the next day's value of the other.
3. Patterns, Clusters, and Outliers
The sample points reveal several notable structural features. There appears to be a lower cluster concentrated roughly between X values of 80M–170M and Y values of 20–30, reflecting the relatively calmer second half of 2009 as markets stabilized post-crisis. A second, more dispersed upper cluster emerges above Y = 35, associated with X values generally exceeding 160M–170M, likely corresponding to the volatile early months of 2009 when the financial crisis was still acute. A few conspicuous outliers are visible — notably the point near (33.8M, ~19.7), which represents an unusually low-volume, low-volatility day and sits well apart from the main cloud. Similarly, points approaching X = 254M with moderate Y values (e.g., ~32) suggest occasional high-volume days that did not coincide with extreme VIX spikes, hinting at non-volatility-driven volume episodes. The scatter also appears to fan slightly wider at higher X values, suggesting mild heteroscedasticity.
4. Confounding Factors and Caveats
Several important caveats temper interpretation. First, 2009 is an extraordinary year — spanning the tail of the 2008–2009 financial crisis, the March 2009 market bottom, and a dramatic recovery rally — meaning the correlation may be heavily regime-dependent and not generalizable to other periods. Second, Tape B shares specifically represent NYSE American (AMEX) and regional exchange-listed securities, which may respond to volatility differently than the broader market the VIX measures. Third, the absence of Granger causality suggests a common driver (e.g., macroeconomic news shocks, Federal Reserve announcements, earnings seasons) may be simultaneously moving both variables, making the correlation spurious in a causal sense. Fourth, the dataset's N of 3,232 versus the sample n of 252 suggests this analysis covers a sampled subset, and sampling methodology could influence results. Finally, the linear model's assumptions may not fully hold given the apparent heteroscedasticity and potential non-linearity in the upper range.
5. Actionable Insights and Further Investigation
Despite the non-causal finding, the ~50% explained variance makes this relationship operationally meaningful for market microstructure analysis and exchange capacity planning — on high-VIX days, elevated Tape B volume is a reasonable expectation. For further investigation, analysts should: (1) test non-linear models (e.g., logarithmic or polynomial fits) to better capture the apparent fanning pattern; (2) segment the data by market regime (pre/post March 2009 bottom) to test whether the correlation is being driven primarily by the crisis period; (3) extend the Granger analysis to longer lags (2–5 periods) to rule out slower predictive dynamics; (4) control for confounders such as S&P 500 returns, Fed announcement days, and options expiration cycles; and (5) compare against Tape A and Tape C volumes to determine whether the VIX–volume relationship is specific to Tape B securities or a market-wide phenomenon.
X dataset: Cboe U.S. Equities Historical Market Volume Data 2009
Y dataset: VIX Daily Index
Part of experiment: Daily - Cboe U.S. Equities Historical Market Volume Data 2009 vs VIX Daily Index