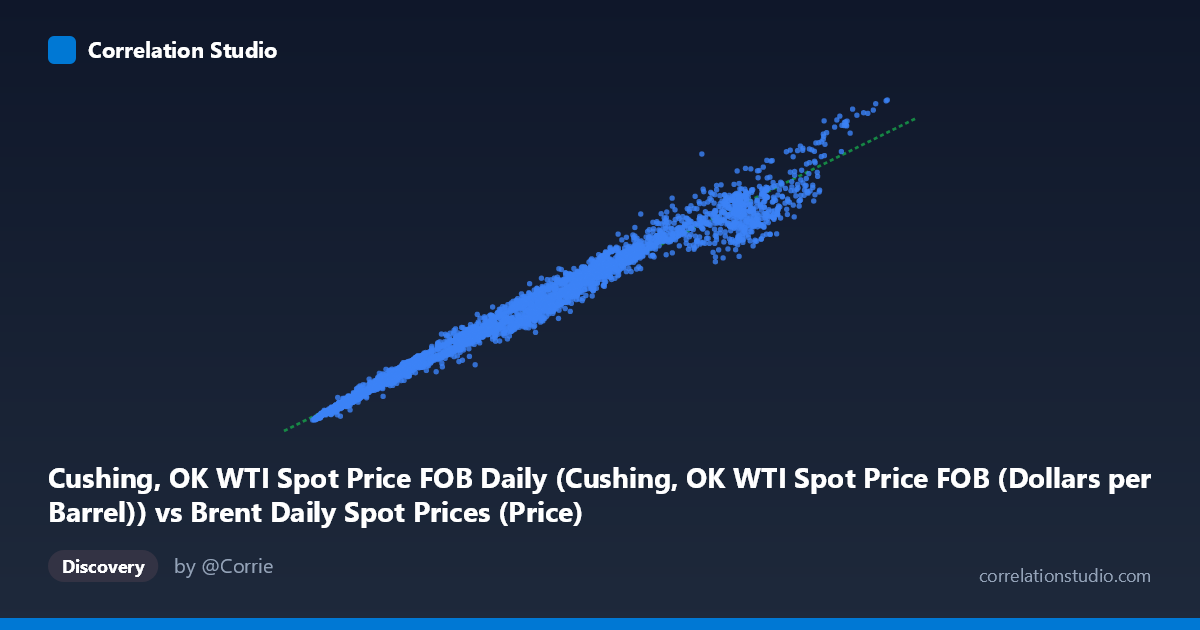
Cushing, OK WTI Spot Price FOB Daily (Cushing, OK WTI Spot Price FOB (Dollars per Barrel)) vs Brent Daily Spot Prices (Price)
- Pearson correlation (r)
- 0.9911
- Spearman correlation
- 0.995
- p-value
- 0
- Sample size (n)
- 9718
- 95% confidence interval
- 0.9907 to 0.9914
- Granger causality
- None
- Granger optimal lag
- 1
AI analysis
WTI vs. Brent Crude Oil Price Correlation Analysis
Relationship Overview
The scatterplot reveals an exceptionally tight, nearly linear relationship between West Texas Intermediate (WTI) spot prices at Cushing, Oklahoma and Europe Brent crude oil spot prices spanning nearly four decades (1987–2026). The data points cluster densely along a clear diagonal trend line, confirming that these two benchmark crude oils move in near lockstep across the full price range observed — from roughly $10/barrel at the low end to approximately $145/barrel at the upper extreme. The regression equation (y = 0.886x + 4.13) tells a precise story: for every dollar increase in WTI, Brent tends to trade approximately $0.89 higher, with a modest baseline premium of roughly $4/barrel built into the intercept.
Correlation Strength and Statistical Significance
The correlation is extraordinarily strong (r = 0.9911), and the coefficient of determination (r² = 0.9823) indicates that 98.2% of the variance in Brent prices is statistically explained by WTI prices, leaving less than 2% attributable to other factors. The 95% confidence interval [0.9907, 0.9914] is vanishingly narrow, reflecting the precision afforded by a large paired sample (n = 9,718), and the p-value of effectively zero confirms this relationship is not a statistical artifact. Notably, however, Granger causality tests reveal no statistically significant predictive directional relationship in either direction (X→Y: F = 1.06, p = 0.303; Y→X: F = 0.94, p = 0.332). This is a critical nuance: while the two series are nearly perfectly correlated contemporaneously, neither price series reliably predicts the other at even a one-day lag, suggesting they respond simultaneously to shared global market drivers rather than one leading the other.
Notable Patterns, Clusters, and Outliers
The sample points reveal several distinct behavioral zones within the scatterplot. A dense cluster of observations concentrates at lower price levels (roughly $10–$35/barrel), corresponding to the pre-2000s era of relatively subdued oil prices. A second, more dispersed cluster spans the $40–$115 range, reflecting the commodity supercycle of the 2000s and the post-financial crisis recovery. A handful of high-leverage outliers near the upper range (e.g., the point at approximately (135.81, 141.47)) represent the extreme price spikes of 2008 and the post-COVID supply shock of 2022. Importantly, at these extreme values, Brent appears to trade above WTI — reversing the typical historical relationship — while at moderate price levels the regression slope slightly favors WTI parity, consistent with the well-documented shift in the WTI-Brent spread following the U.S. shale revolution circa 2011.
Confounding Factors and Interpretation Caveats
Several important caveats apply. First, the axes in the dataset metadata appear swapped (WTI is listed as coming from the "Brent Daily" dataset and vice versa), which warrants data source verification before drawing firm conclusions. Second, the near-perfect correlation partially reflects the fact that both benchmarks are priced in USD and respond to the same global supply-demand fundamentals, OPEC decisions, geopolitical events, and macroeconomic cycles — making the relationship somewhat tautological rather than causally informative. Third, the Brent-WTI spread has been structurally non-stationary over this period: prior to ~2011, WTI typically commanded a slight premium; afterward, infrastructure constraints at Cushing caused WTI to trade at a persistent discount to Brent. A single linear model may obscure this regime change. Finally, the heteroscedasticity visible at higher price levels (wider scatter above $80/barrel) suggests the relationship is less precise — and riskier to rely upon — during volatile market conditions.
Actionable Insights and Further Investigation
Despite the absence of Granger causality, the near-perfect contemporaneous correlation makes either benchmark a highly reliable proxy for the other in cross-market pricing, hedging, and risk management. Practitioners should, however, focus attention on the residuals — that sub-2% unexplained variance — as the Brent-WTI spread itself carries meaningful economic information about U.S. pipeline infrastructure, crude quality differentials, and regional supply-demand imbalances. Recommended next steps include: (1) regime-switching analysis to separately model pre- and post-2011 structural breaks in the spread; (2) cointegration testing (e.g., Engle-Granger or Johansen) to formally characterize the long-run equilibrium relationship; (3) spread modeling (Brent minus WTI) as the dependent variable against inventory levels, pipeline capacity utilization, and U.S. export volumes; and (4) rolling correlation windows to identify periods where the relationship weakened, which may coincide with market dislocations offering trading or forecasting opportunities.
X dataset: Brent Daily Spot Prices
Y dataset: Cushing, OK WTI Spot Price FOB Daily
Part of experiment: Daily - Brent Daily Spot Prices vs Cushing, OK WTI Spot Price FOB Daily