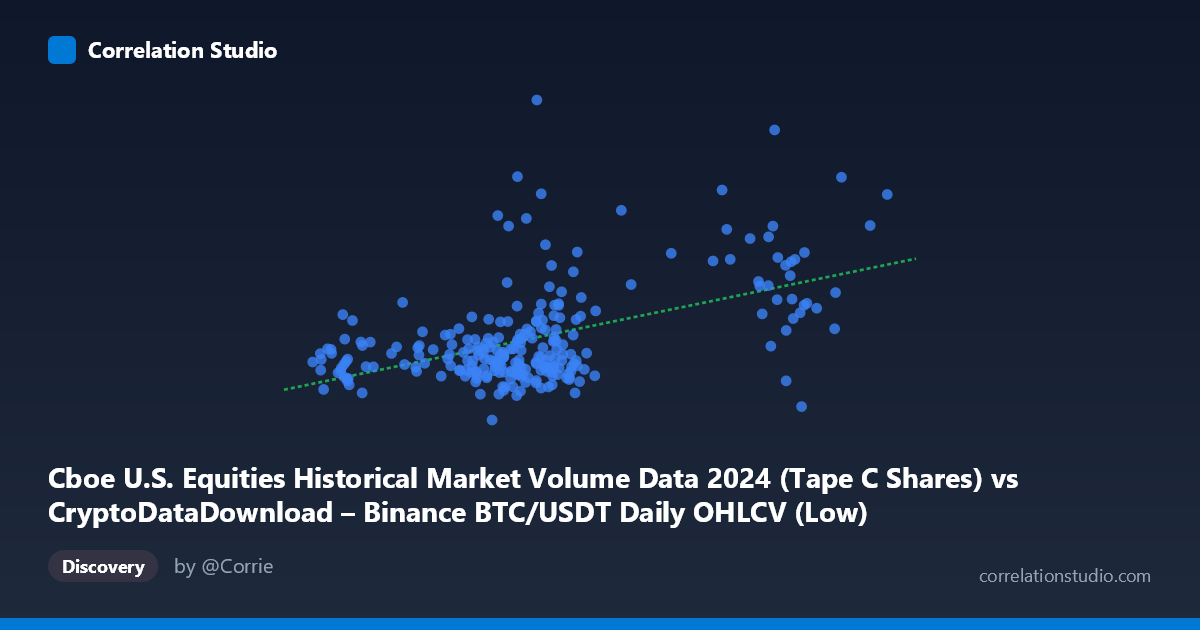
Cboe U.S. Equities Historical Market Volume Data 2024 (Tape C Shares) vs CryptoDataDownload – Binance BTC/USDT Daily OHLCV (Low)
- Pearson correlation (r)
- 0.5105
- Spearman correlation
- 0.3834
- p-value
- 0
- Sample size (n)
- 252
- 95% confidence interval
- 0.413 to 0.5965
- Granger causality
- None
- Granger optimal lag
- 10
- Time coverage
- 2024-01-02 to 2024-12-31
AI analysis
Analysis: Cboe Equity Volume vs. BTC/USDT Daily Low
1. Relationship Overview
The scatterplot depicts a moderate positive linear relationship between Cboe U.S. equities market volume (X) and Binance BTC/USDT daily low price (Y) across 252 paired trading days in 2024. As equity trading volume increases, Bitcoin's daily low price tends to rise as well, though with substantial scatter around the regression line (y = 2558.25x + 152,344,000). The bulk of observations cluster in the X range of 55,000–70,000, with a secondary cluster of higher-volume days (93,000–105,000) that correspond to a somewhat wider spread of BTC prices.
2. Strength, Direction, and Uncertainty
The correlation coefficient (r = 0.51) indicates a moderate positive association, but r² = 0.261 reveals that only about 26% of the variance in BTC's daily low is explained by equity volume — leaving roughly 74% attributable to other factors. The 95% CI [0.413, 0.597] is reasonably tight and excludes zero, and the p-value (~0) confirms this correlation is statistically robust and not due to chance in this sample. However, statistical significance should not be conflated with practical predictive power given the large unexplained variance. Critically, the Granger causality tests show no significant predictive direction in either direction (X→Y: p=0.363; Y→X: p=0.430) even at an optimal lag of 10 periods. This means neither series reliably "leads" the other temporally — the correlation is contemporaneous/coincidental rather than causal or forecastable, likely both reflecting a common underlying driver (e.g., macro risk sentiment or seasonal market activity in 2024).
3. Notable Patterns and Outliers
Several features stand out: - Two X-density regions: a dense cluster around 55,000–70,000 (typical daily volume) and a sparser cluster around 93,000–105,000, suggesting possible distinct volume regimes (perhaps triple-witching days, index rebalancing, or high-volatility periods). - Vertical scatter at fixed X: at X≈65,000, Y ranges from ~252M to ~523M — a nearly 2x spread — indicating BTC price is driven by factors largely independent of equity volume on any given day. - Potential outlier: the point (65106, 523,325,270) is a high-Y value at moderate X, sitting well above the regression line, possibly corresponding to a BTC rally day unrelated to equity activity. - No strong non-linearity is evident; the relationship appears adequately captured by a linear fit, though the high-X cluster shows more y-variance, hinting at mild heteroscedasticity.
4. Confounding Factors and Caveats
This correlation is almost certainly spurious or indirect rather than causal. Both series may be driven by shared macro factors — overall market risk appetite, monthly/quarterly calendar effects (e.g., options expirations, rebalancing dates driving equity volume; halving anniversary or ETF flow news driving BTC), or simply shared time-trends within 2024 (e.g., both assets rising over the year). Equity volume and crypto price are structurally different asset classes with different market hours, participants, and liquidity drivers, making a direct economic mechanism linking them unlikely. Additionally, daily-level aggregation may mask more meaningful relationships at intraday or weekly frequencies, and 2024's unique events (spot BTC ETF launches, election-related market activity) could be common confounders inflating the correlation without genuine linkage.
5. Suggestions for Further Investigation
- Test for confounders: control for known 2024 events (ETF approval dates, FOMC announcements, elections) using multivariate regression or event-study methods to see if the correlation persists. - Explore lagged/leading relationships more granularly: the Granger test found no causality at daily aggregation with lag 10; testing shorter lags (1–5 days) or intraday data might reveal short-term dynamics. - Segment analysis: separately analyze the high-X cluster (93K–105K) versus the main cluster to see if the relationship strength differs by volume regime. - Introduce a third variable: incorporate a common macro proxy (e.g., VIX, S&P 500 volume/returns) to test whether the BTC–Cboe correlation is mediated by broader market sentiment. - Treat this as a monitoring metric, not a trading signal: given the lack of Granger causality and modest r², this pairing should not be used for predictive trading strategies without much stronger causal evidence.
X dataset: CryptoDataDownload – Binance BTC/USDT Daily OHLCV
Y dataset: Cboe U.S. Equities Historical Market Volume Data 2024
Part of experiment: Bitcoin - CryptoDataDownload – Binance BTC/USDT Daily OHLCV vs Cboe U.S. Equities Historical Market Volume Data 2024