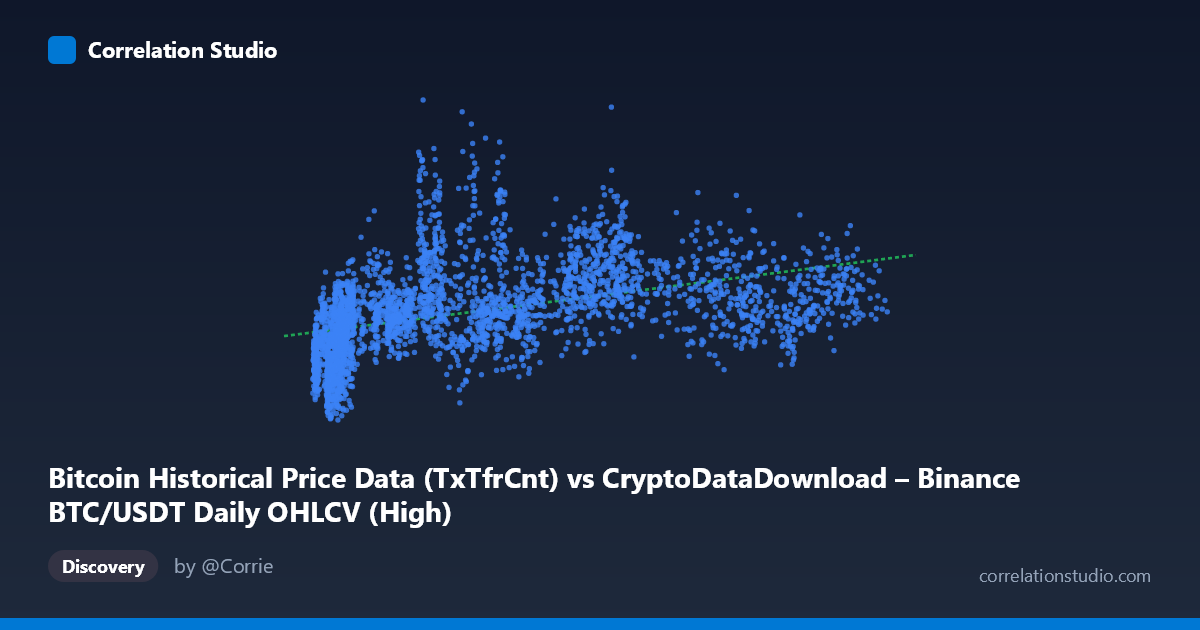
Bitcoin Historical Price Data (TxTfrCnt) vs CryptoDataDownload – Binance BTC/USDT Daily OHLCV (High)
- Pearson correlation (r)
- 0.4353
- Spearman correlation
- 0.6014
- p-value
- 0
- Sample size (n)
- 3191
- 95% confidence interval
- 0.4067 to 0.463
- Granger causality
- None
- Granger optimal lag
- 10
- Time coverage
- 2017-08-17 to 2026-05-20
AI analysis
Analysis: Bitcoin Transfer Count vs. Price (High)
1. What the Visualization Reveals
The scatterplot shows a moderate, positive but noisy relationship between Bitcoin's daily on-chain transaction count (TxTfrCnt) and its daily high price on Binance BTC/USDT. Rather than a tight linear band, points are widely scattered — at any given transfer-count level (say, ~10,000), the corresponding price varies enormously (from ~$370K to over $1.2M in the sample), indicating that transfer count alone is a weak predictor of price on any given day.
2. Strength, Direction, and Statistical Confidence
The Pearson correlation (r = 0.435) indicates a weak-to-moderate positive relationship, with r² = 0.19, meaning transfer count explains only about 19% of the variance in BTC's price high — leaving over 80% attributable to other factors. The 95% CI [0.407, 0.463] is tight and does not cross zero, and the p-value ≈ 0 confirms this correlation is statistically robust and not due to chance, despite its modest magnitude (likely a function of the large sample size, n = 3,191).
Critically, the Granger causality test finds no significant predictive direction in either direction (X→Y: p = 0.257; Y→X: p = 0.924) at the optimal lag of 10 periods. This means neither on-chain transfer activity nor price meaningfully "leads" the other in a time-series forecasting sense — the correlation is contemporaneous/structural rather than temporally predictive. Practically, you cannot use today's transfer count to forecast tomorrow's price (or vice versa) with this model.
3. Notable Patterns and Non-linear Features
The data shows a fan/cone shape: at low transfer counts (<15,000), prices span a huge range ($370K–$1.2M+), while higher transfer counts (80,000) cluster more narrowly around $850K–$1.1M. This suggests heteroscedasticity — variance in Y shrinks as X increases — a hallmark of non-linear relationships. The note that Spearman ρ exceeds Pearson r supports this: the relationship may be better captured by a logarithmic or power curve (common in crypto data, where transfer counts and price both often follow log-normal-ish distributions) rather than the straight line implied by y = 2.474x + 717,869.
4. Confounding Factors and Caveats
Several caveats apply: - Time trend confounding: Both series (2017–2026) likely have independent long-term upward trends driven by broader crypto adoption, halving cycles, and macro conditions — inflating correlation without genuine causal linkage. - Mismatched Y source: Note the Y-axis label mixes "TxTfrCnt" description with an OHLCV "High" price column — check for a data-labeling or column-mapping error, as the metadata is inconsistent (X claims to be price data but is described as transfer count). - Exchange-specific price vs. network-wide activity: Binance price may not reflect global BTC price/liquidity dynamics tied to on-chain metrics. - Non-stationarity: Crypto price and network activity are typically non-stationary; Granger tests and Pearson r on raw (non-differenced) series can be misleading — results should be re-verified on detrended/differenced data.
5. Actionable Next Steps
1. Clarify data provenance — resolve the apparent mismatch in column descriptions before drawing further conclusions. 2. Fit non-linear models (log-log or polynomial regression) given the Spearman/Pearson divergence and visible fan pattern. 3. Detrend/difference both series and re-run correlation and Granger tests to control for shared long-term trends and non-stationarity. 4. Segment by market regime (bull/bear cycles, halving periods) to see if the r² is driven by specific volatile periods. 5. Treat this as a structural/contemporaneous association at best — not suitable for short-term forecasting given the null Granger result.
X dataset: CryptoDataDownload – Binance BTC/USDT Daily OHLCV
Y dataset: Bitcoin Historical Price Data
Part of experiment: Bitcoin - CryptoDataDownload – Binance BTC/USDT Daily OHLCV vs Bitcoin Historical Price Data