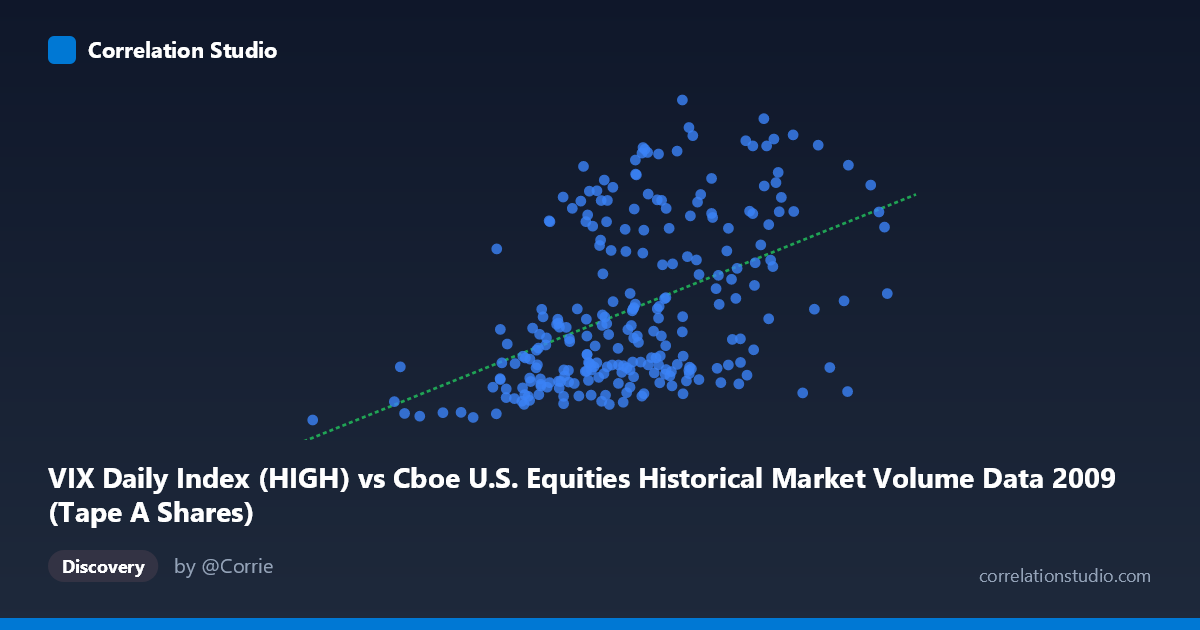
VIX Daily Index (HIGH) vs Cboe U.S. Equities Historical Market Volume Data 2009 (Tape A Shares)
- Pearson correlation (r)
- 0.464
- Spearman correlation
- 0.4788
- p-value
- 0
- Sample size (n)
- 252
- 95% confidence interval
- 0.3611 to 0.5557
- Granger causality
- None
- Granger optimal lag
- 1
AI analysis
Scatterplot Analysis: VIX Daily Index (HIGH) vs. Tape A Shares (2009)
Relationship Overview
The scatterplot reveals a moderate positive relationship between the VIX Daily Index High values and Tape A Share volume for U.S. equities exchanges in 2009. As VIX high readings increase — indicating elevated market fear or uncertainty — Tape A share volumes tend to rise correspondingly. The linear regression equation (y = 4.56E-08x + 12.76) confirms this upward trend, consistent with the well-established market dynamic that heightened volatility episodes typically drive increased trading activity. The data spans the full calendar year 2009, a period that included both the tail end of the financial crisis and the subsequent recovery rally, making this an exceptionally turbulent and informative year for volatility-volume relationships.
Correlation Strength and Statistical Significance
The Pearson correlation of r = 0.464 indicates a moderate positive association, but the explanatory power is notably limited: r² = 0.2153 means only about 21.5% of the variance in Tape A shares is attributable to VIX highs, leaving roughly 78.5% explained by other factors. The 95% confidence interval of [0.361, 0.556] is meaningfully above zero and reasonably tight given n = 252, suggesting the correlation estimate is stable. The p-value of 7.33E-15 confirms the relationship is highly statistically significant — effectively ruling out chance — particularly given the population context of N = 3,232 trading observations. However, the Granger causality tests undercut any causal narrative: neither direction (X→Y: F = 0.557, p = 0.456; Y→X: F = 1.318, p = 0.252) approaches conventional significance thresholds. This means that past VIX highs do not reliably predict future share volume, nor does past volume predict future VIX readings at the one-period lag tested.
Notable Patterns, Clusters, and Outliers
Several structural features stand out in the data. A prominent dense cluster exists in the lower-left region, roughly where VIX highs fall between 300–550 million and Tape A shares range between 20–35, reflecting the more "normal" post-crisis stabilization period of mid-to-late 2009. There is also visible vertical spread at moderate X values, suggesting that a given VIX level can correspond to a wide range of share volumes — reinforcing the modest r². A handful of high-leverage outliers appear in the upper-right quadrant (e.g., points near VIX highs of 630–704 million paired with Tape A shares of 47–57), likely corresponding to specific high-stress trading days in early 2009. The point at approximately (105.7M, 19.67) in the lower-left stands alone as a potential low-volume anomaly. The scatter also hints at a possible non-linear or threshold effect, where the positive association strengthens at extreme VIX levels, though the linear model may be oversimplifying this dynamic.
Confounding Factors and Interpretive Caveats
Several important caveats temper interpretation. First, 2009 is an extreme year — spanning post-Lehman collapse panic, the March 2009 market bottom, and a sharp recovery — meaning the correlation may reflect regime-specific dynamics rather than a generalizable structural relationship. Second, axis labeling appears inverted in the metadata (VIX is listed under the X-axis from the volume dataset and vice versa), warranting verification of which variable is truly driving the relationship conceptually. Third, share volume is influenced by numerous confounders including algorithmic trading surges, index rebalancing events, earnings seasons, and macroeconomic announcements — none of which are captured here. Finally, the one-period Granger lag may be too short to detect meaningful predictive relationships; multi-day lags might reveal different dynamics, especially given the autocorrelated nature of both volatility and volume series.
Actionable Insights and Further Investigation
Despite the modest explanatory power, the statistically robust correlation offers several practical directions. Analysts should test non-linear models (e.g., log-log or polynomial regression) given the apparent heteroscedasticity and potential threshold effects at extreme VIX levels. Investigating multi-lag Granger causality (e.g., 5- or 10-day lags) could uncover delayed volume responses to sustained volatility regimes. It would also be valuable to segment the data by market regime — separating the crisis phase (Q1 2009) from the recovery phase (Q2–Q4) — to determine whether the correlation is driven primarily by extreme observations. Incorporating additional predictors such as bid-ask spreads, put/call ratios, or sector-specific flows into a multivariate model would likely substantially improve variance explained beyond the current 21.5%. Finally, replicating this analysis across other years would test whether this correlation is a persistent structural feature or an artifact of 2009's extraordinary market conditions.
X dataset: Cboe U.S. Equities Historical Market Volume Data 2009
Y dataset: VIX Daily Index
Part of experiment: Daily - Cboe U.S. Equities Historical Market Volume Data 2009 vs VIX Daily Index